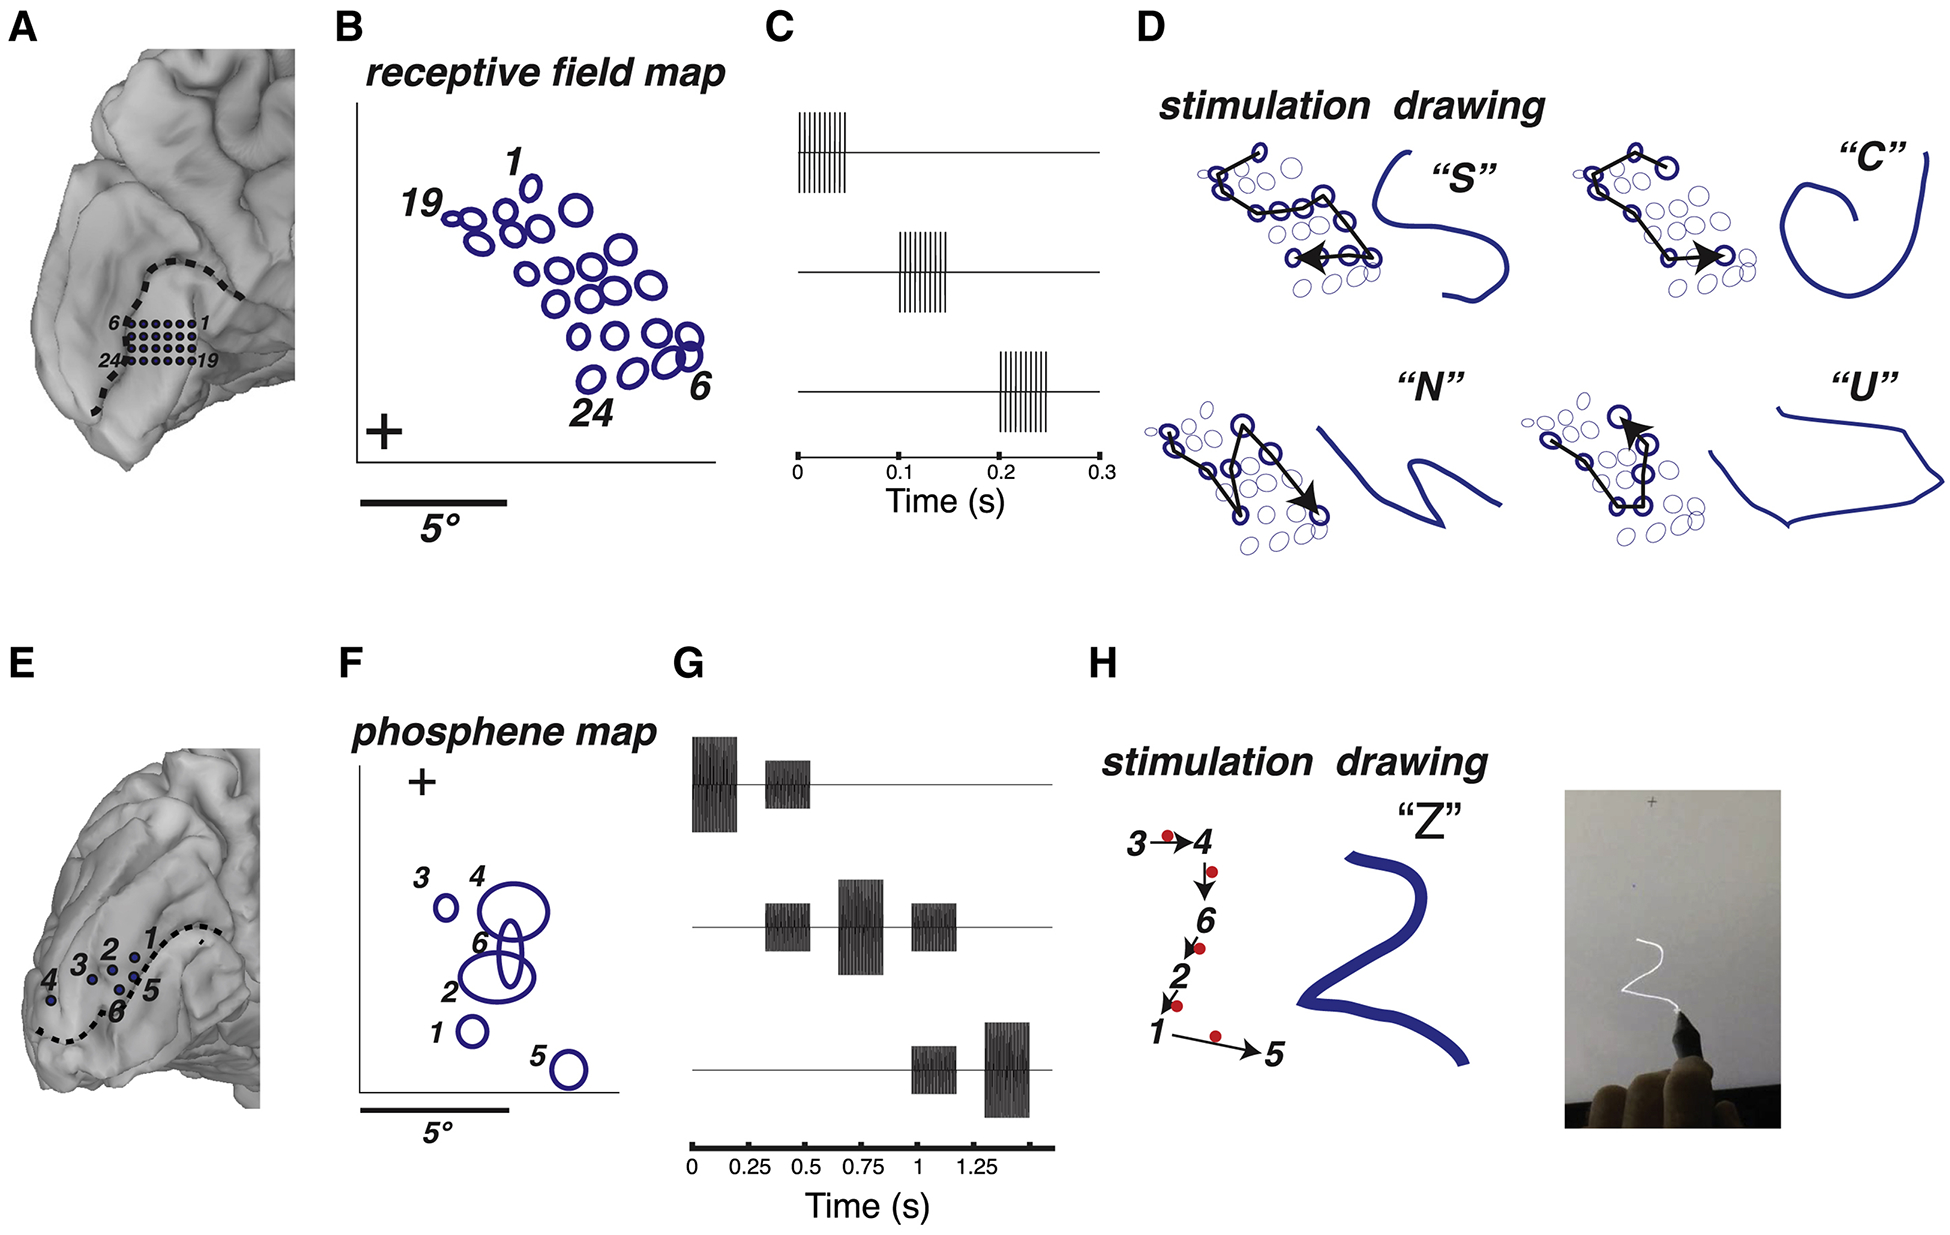
Figure 4. Dynamic stimulation produces perception of letter forms in sighted participants.

(A) Medial view of the left occipital lobe of sighted participant YBN. Blue circles show the 24 electrodes contained in a grid implanted inferior to the calcarine sulcus (dashed black line). Black numbers label electrodes and correspond to phosphene numbers in (B). (B) To generate receptive field maps, the participant fixated while mapping stimuli were presented (see Supplementary Figure 1). The blue circles show the location of the receptive field centers for each electrode relative to the fixation point (+). (C) Pulse diagram for dynamic stimulation (without current steering). The timing of the pulses to the first three electrodes in a sequence are shown; pulses to successive electrodes occurred with the same timing. For each electrode, a stimulation current was used that produced a reliable phosphene when that electrode was stimulated in isolation, ranging from 1.2 to 1.5 mA for different electrodes. (D) Dynamic stimulation of selected electrodes was used to generate visual percepts of four different letter forms. For each letter form, the left panel shows the stimulated electrodes (bold circles) and the direction of the temporal sequence of stimulation (arrow). The right panel shows the participant’s actual drawing of the visual percept and the verbal label used to identify it. (E) Medial view of the left occipital lobe of sighted participant YAY. Blue circles show the location of stimulated electrodes relative to calcarine sulcus (dashed black line). (F) Location of individual phosphenes. The participant fixated while electrical stimulation was delivered to one electrode at a time. The participant drew each phosphene on a touchscreen (bold ellipses, numbered by the corresponding electrode). (G) Pulse diagram for dynamic stimulation with current steering. The timing of the pulses to the first three electrodes in a sequence are shown; pulses to successive electrodes occurred with the same timing. Baseline stimulation currents for each electrode ranged from 0.7 mA to 1.5 mA. (H) The phosphene map was used to design a stimulation sequence to produce the visual percept of the letter “Z”. The black arrows show the temporal sequence of stimulated electrodes (black numbers) and virtual electrodes located between the physical electrodes (red dots). The participant drew the pattern they perceived on the touchscreen (blue line in middle panel). Right panel shows still frame from a video of the participant drawing, see Supplementary Video 1 for full video.
