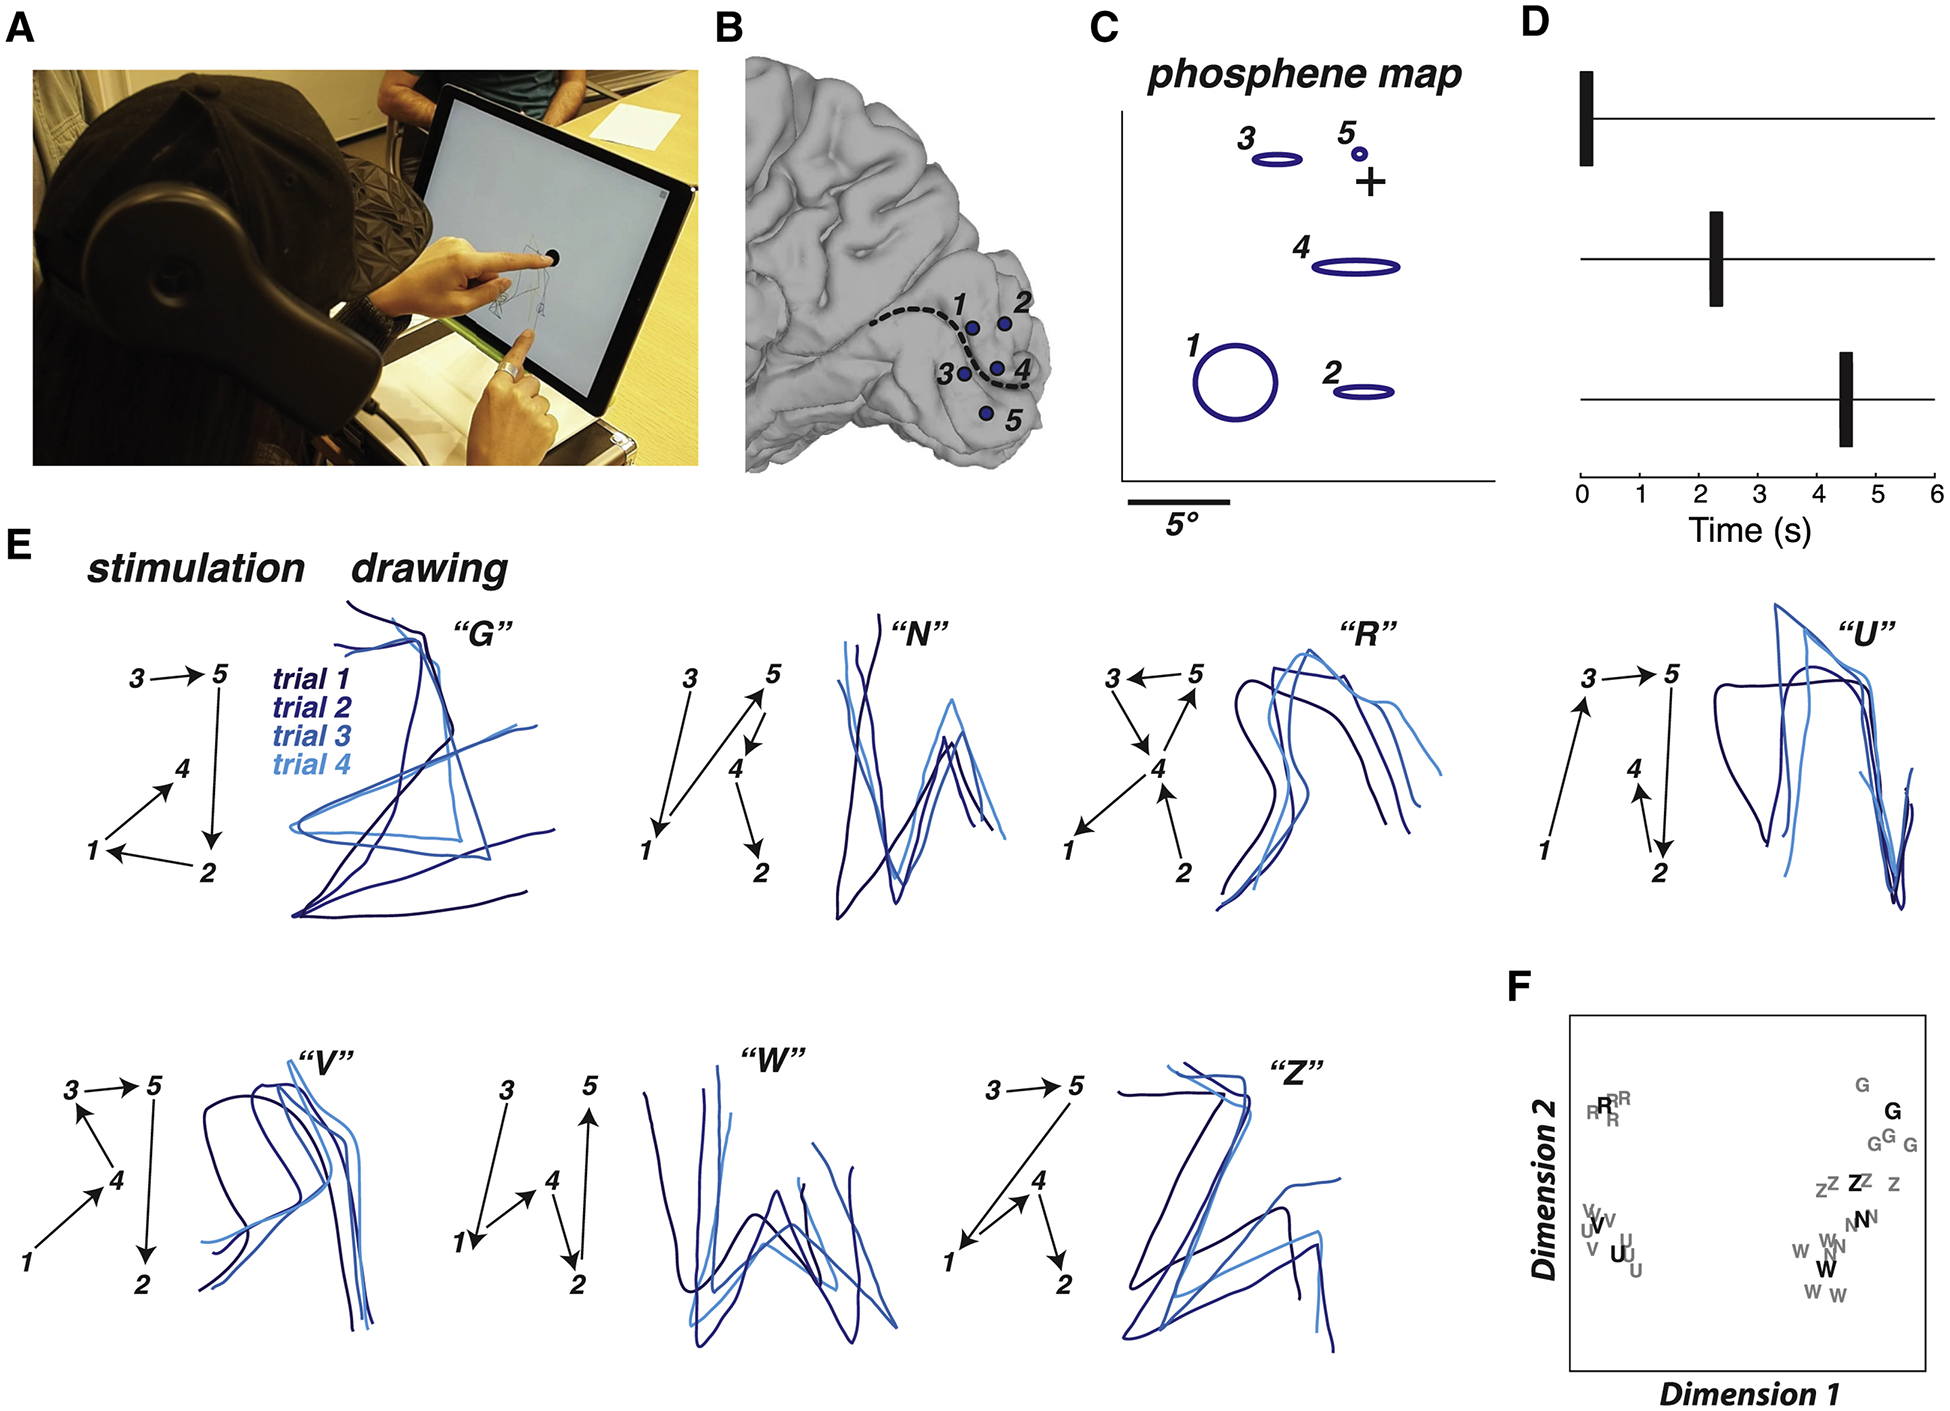
Figure 5. Dynamic stimulation tested in blind participant BAA.

(A) Still frame from a video of the participant drawing, see Supplementary Video 2 for full video. The participant placed the index finger of the left hand on a tactile fixation point in the middle of the touch screen and used the index finger of the right hand to trace the visual percept on the touch screen. (B) Medial view of a surface model of the participant’s right occipital lobe. Dashed line shows calcarine sulcus, circles show electrode locations and numbers. (C) Blue ellipses show participant drawing of phosphenes created by stimulation of individual electrodes, with numbers corresponding to electrodes in (B). Crosshairs show location of tactile fixation point. (D) Dynamic stimulation pulse diagram. The timing of the pulses to the first three electrodes in a sequence are shown; pulses to successive electrodes occurred with the same timing. Stimulation current for all electrodes was 2 mA. (E) Seven different letter-like shapes created by seven different dynamic stimulation patterns. The left panel for each shape shows the temporal sequence of stimulation (electrodes indicated by numbers connected by black arrows). The right panel for each shape shows the participant drawings with each stimulation pattern. Each line illustrates a separate trial (randomly interleaved), colored in different shades of blue for visibility. The letter in quotation marks shows the participant mnemonic for that pattern (backwards “G”; backwards “N”; backwards “R”; upside-down “U”; upside-down “V”; “W”; “Z”). (F) Quantification of the drawings produced by the participant for each trial of each stimulation pattern using multidimensional scaling analysis. Each letter corresponds to a single trial of the corresponding stimulation pattern. Boldface letters show the centroid of each cluster from a k-means analysis.
