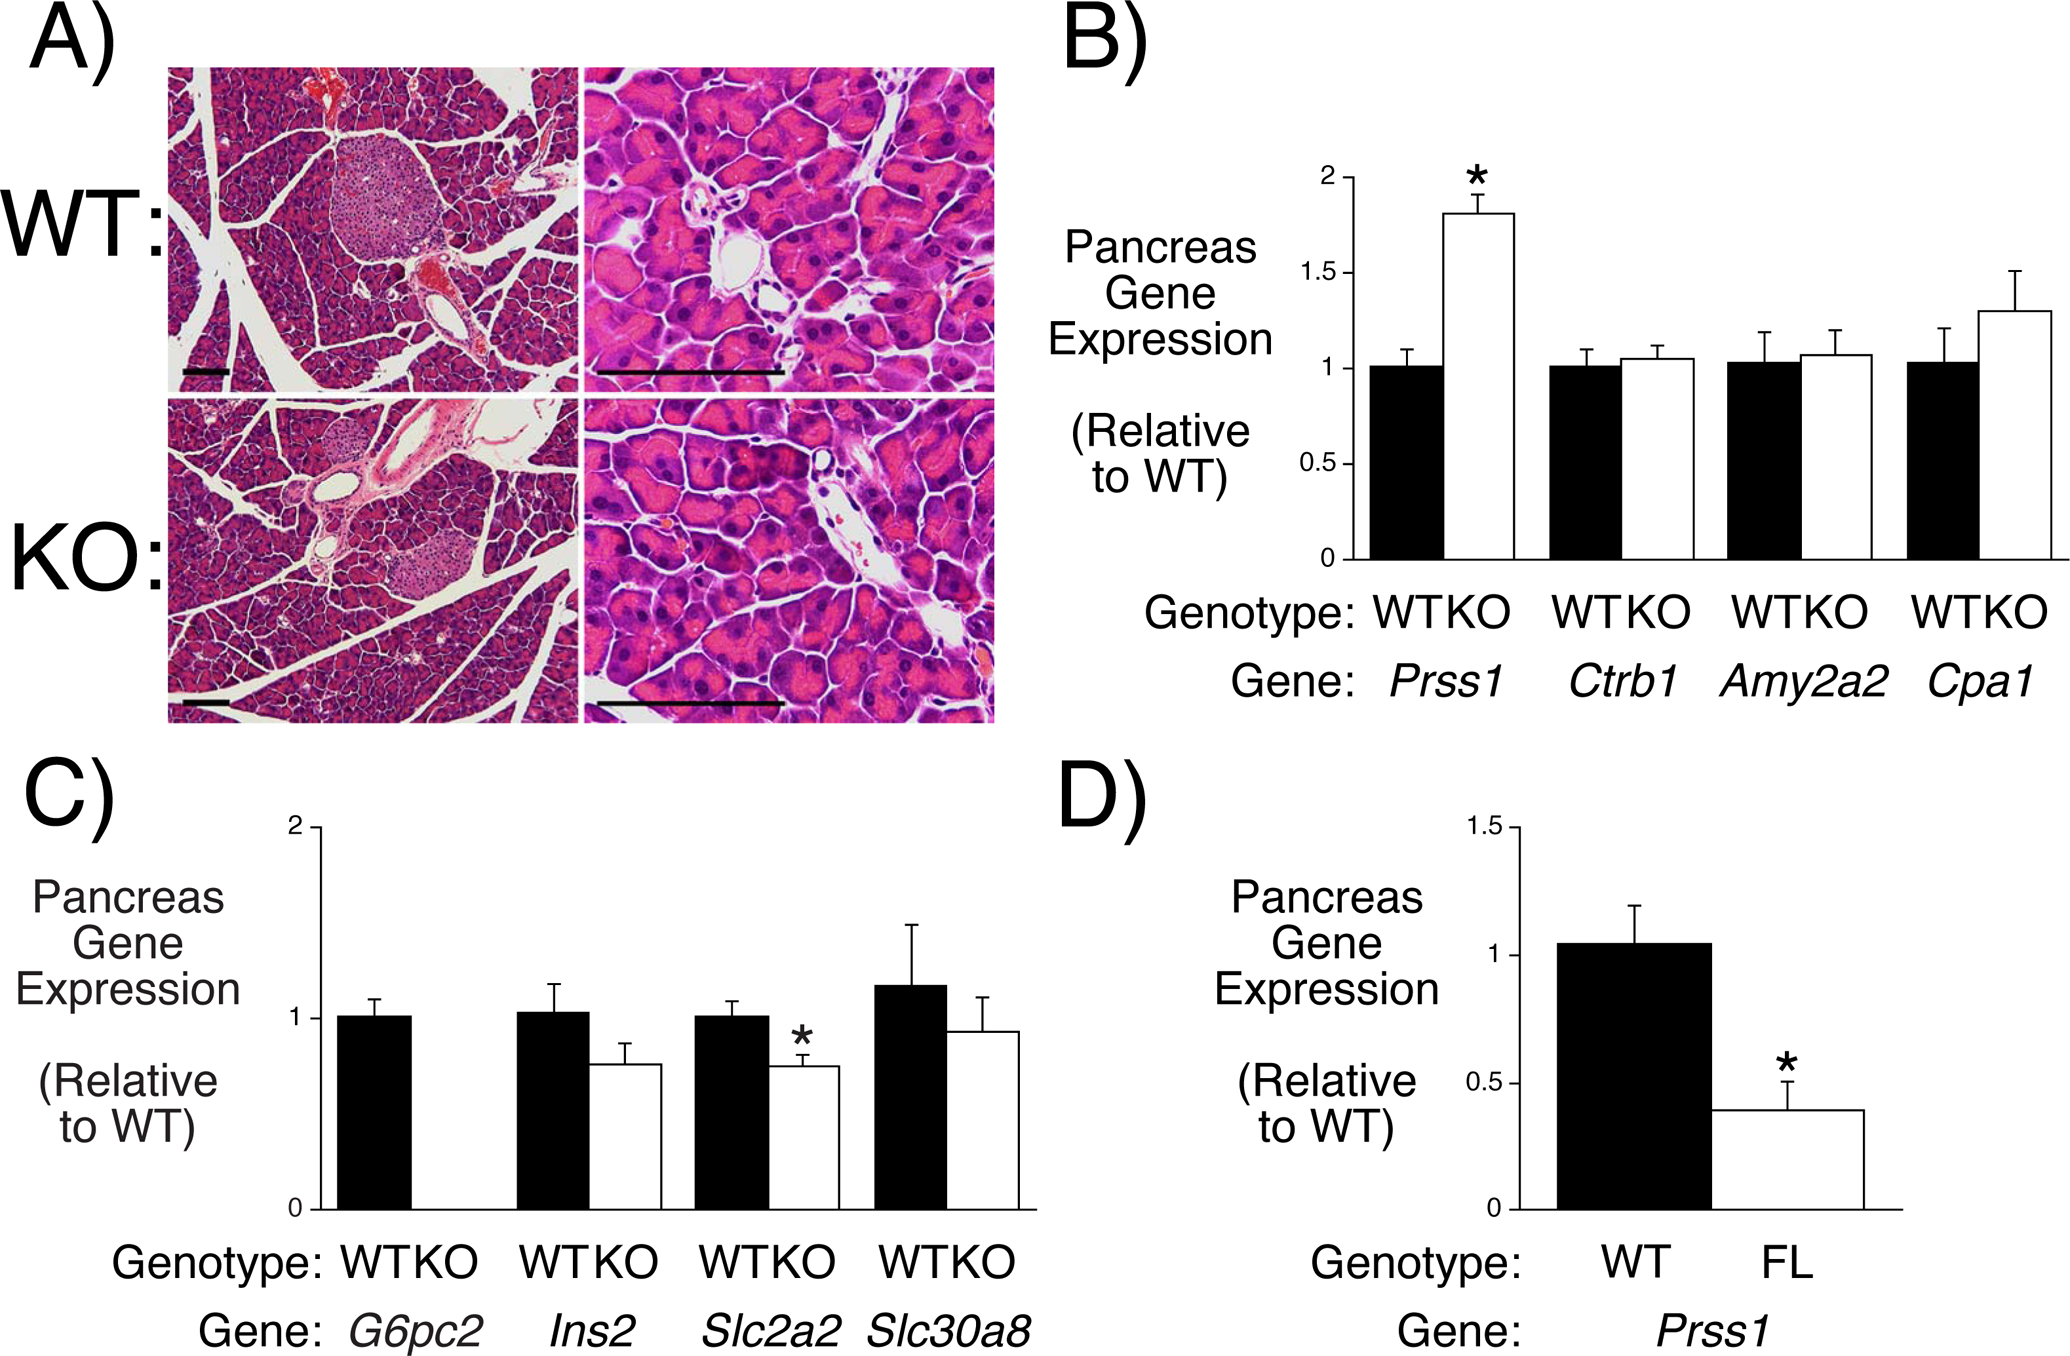
Figure 5. Analysis Pancreatitis and Acinar Gene Expression in Germline G6pc2 KO and Floxed G6pc2 Male Mice.

Panel A: Comparison of pancreatic tissue in WT and germline G6pc2 KO mice. Results are representative of sections analyzed from 3 WT and 3 KO mice. Size bars represent 100 μm. Panels B & C: Comparison of pancreatic acinar gene expression in 6 hr fasted 16 week old male WT and germline G6pc2 KO mice. Gene expression was quantitated relative to Ppia (cyclophilin A) and then expressed relative to that in WT mice. Results represent the mean data ± S.E.M. derived from pancreata isolated from 5 mice. *p < 0.05 vs WT. Panel D: Comparison of pancreatic gene expression in 6 hr fasted 16 week old male WT and BCS G6pc2 KO mice following tamoxifen treatment. The RNA samples were a subset of those used in Figs. 5G-I. Gene expression was quantitated relative to Ppia (cyclophilin A) and then expressed relative to that in WT mice. Results represent the mean data ± S.E.M. derived from pancreata isolated from 5 mice. *p < 0.05 vs WT.
