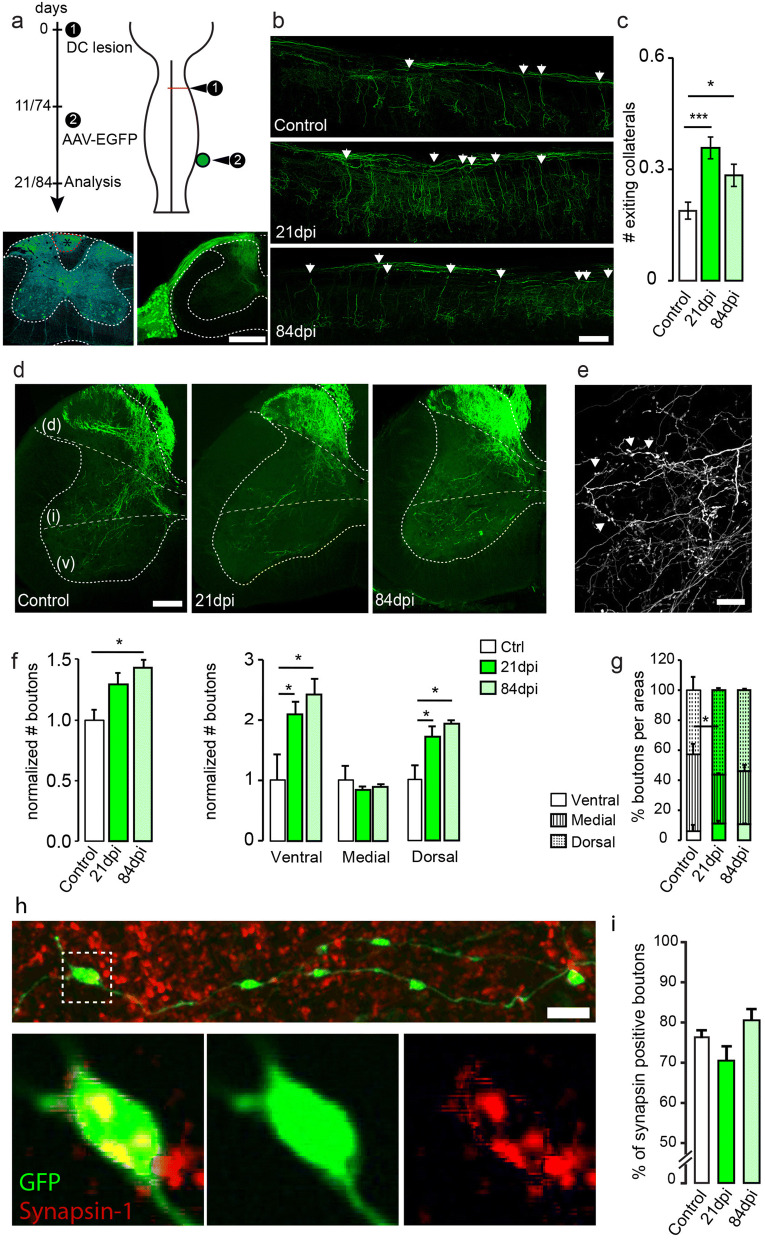
Figure 2.
Dorsal column lesion triggers sprouting of DRG collaterals. (a) Experimental setup (top) of the dorsal column lesion paradigm and labeling of DRG ascending fibers. Confocal images (bottom) of the center of a representative dorsal column lesion (bottom left) and of a DRG injected with an AAV-EYFP (bottom right) showing the pattern of spinal cord innervation. (b) Confocal images of cervical DRG collaterals exiting into the grey matter in unlesioned (control) and lesioned mice at 21 and 84 days post-injury (dpi; arrowheads indicate examples of exiting collaterals; longitudinal view). (c) Quantitative analysis of collaterals exiting into the cervical grey matter (***: p = 0.0005; *: p = 0.0183 compared to controls. n = 10–17 mice per group). (d) Confocal coronal images of cervical DRG collaterals exiting into the grey matter in unlesioned (control) and lesioned mice at 21 and 84 dpi. Lines on the spinal cord represent the different areas analyzed (dorsal/intermediate and ventral). (e) Representative confocal images of the boutons quantified on DRG axon collaterals (image from control animal). (f) Quantification of the normalized number of boutons and their change following the lesion (left: general changes; *: p = 0.0285 and right: relative changes in every examined regions *: p = 0.0408 and p = 0.0210 ventral and *: p = 0.0417 and p = 0.0217 dorsal). (g) Localization of DRG boutons in the ventral (left panel), intermediate (middle panel) and dorsal (right panel) parts of the cervical spinal cord. Medial: *: p = 0.0386. (h) Confocal images of boutons along DRG collaterals double-labeled with synapsin. Bottom pictures are magnifications of the area boxed in the top picture (GFP: green, synapsin-1: red). (i) Quantification of the percentage of boutons double-labeled with synpasin-1 in controls and 21 or 84 days following dorsal column lesions. Data analyzed tested for normality (non-normal distribution for c,f,g; normal distribution for i) and analyzed with corresponding tests using Kruskall-Wallis test followed by Dunn’s test in (c), (f) and (g) and tested with a one-way ANOVA followed by post-hoc Dunnett’s’s test for (i). In (i) n = 471 to 964 counted boutons per group (control: 471; 3 weeks: 567; 12 weeks: 964 boutons). N = 3 mice per group. Scale bars equal 400 µm in (a), 200 µm in (b, d), 50 µm in (e) and 5 µm in (h). Insets below (h) are magnified 4 times from (h).

