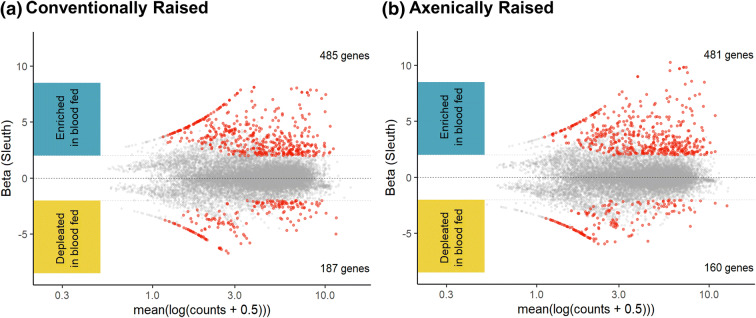
Figure 6.
MA plots of significantly expressed mosquito genes during a blood or sugar meal. The beta value in Sleuth indicates the estimated fold change for each gene. Each dot is representative of one gene; grey dots represent no significant differences between axenic and conventionally raised groups. Red dots represent genes that were either enriched (above the x-axis) or depleted (below the x-axis) and were considered biologically significant. The two groups investigated were midguts conventionally raised (a), and midguts axenically raised (b).

