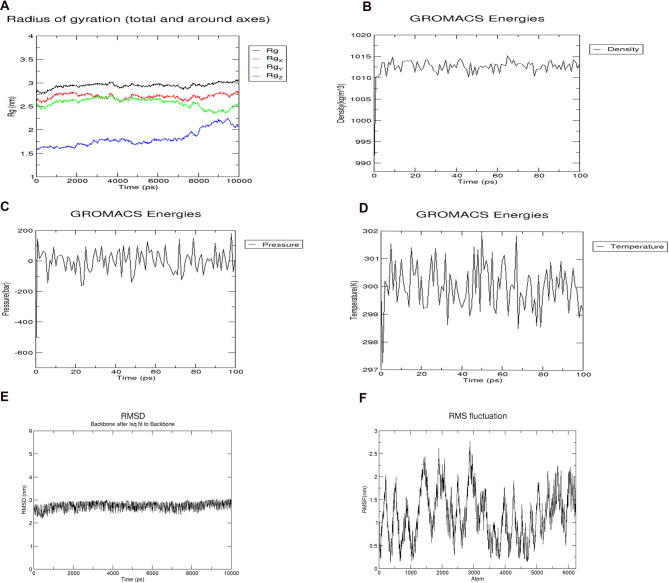
Figure 10.
(A) Radius of Gyration plot showing compactness of the vaccine around its axes. (B) Graph showing density of the system during simulation. (C) Graph showing the pressure of the system during simulation. (D) Graph showing the equilibrated temperature during energy minimisation. (E) RMSD plot of the vaccine construct indicating stability. (F) RMSF plot of the vaccine construct showing high fluctuations, indicating high flexibility.

