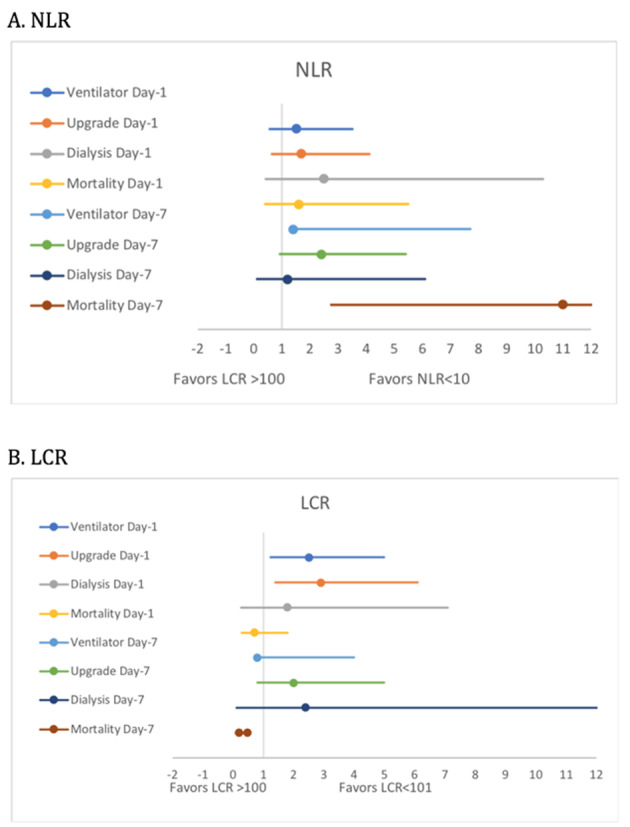
Figure 3.

Forest plots of unadjusted odds ratio of outcomes across NLR and LCR groups. NLR: neutrophil-to-lymphocyte ratio; LCR: lymphocyte-to-C-reactive protein ratio.

Forest plots of unadjusted odds ratio of outcomes across NLR and LCR groups. NLR: neutrophil-to-lymphocyte ratio; LCR: lymphocyte-to-C-reactive protein ratio.