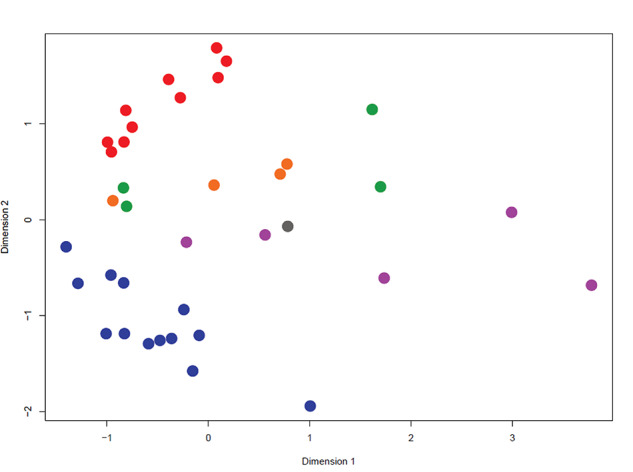
Figure 2.

Multidimensional scaling plot based on differentially expressed genes (FDR of P < 0.05 and a fold change >2 or <0.5). Blue = NP-control, red = NP-CSF2, green = PP-control, purple = PP-CSF2, orange = PNP-control, and gray = PNP-CSF2. NP, not pregnant at day 30; PP, pregnant at day 60; PNP, pregnant and day 30 but not at day 60.
