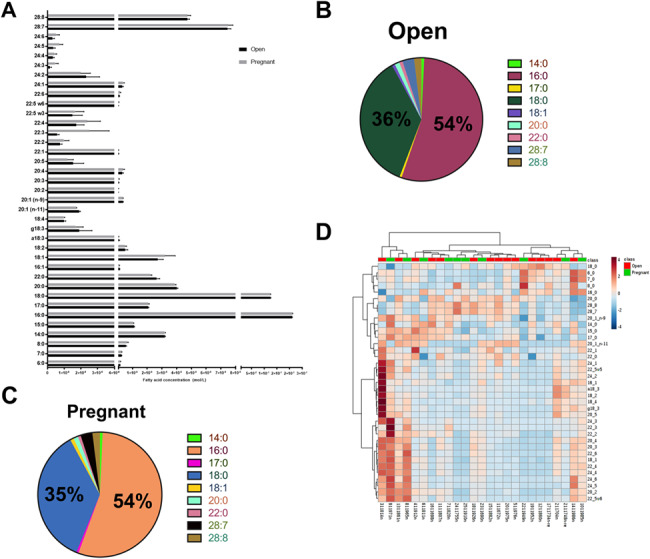
Figure 5. Concentrations of fatty acids identified in the ULF of the fertility-classified heifers (A). Proportion of the nine most abundant fatty acids in the ULF relative to the total fatty acid content detected for open (B) and pregnant (C) fertility-classified heifers. Heatmap (D) for fatty acid concentration (molar) in the uterine lumen flush (ULF) across samples.

