
Figure 2.
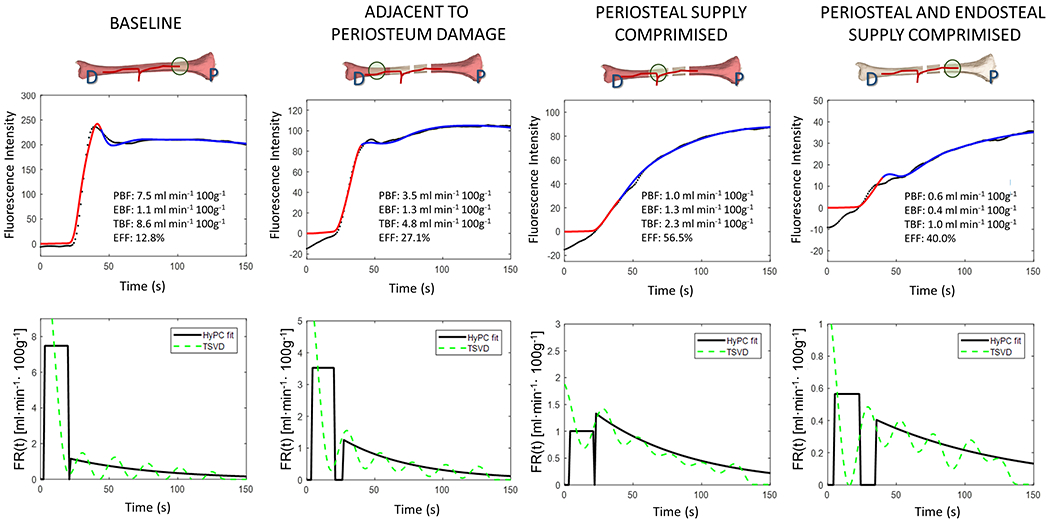
Top Row. ICG intensity (black dots) measured during baseline, after endosteal flow is disrupted and after both endosteal and periosteal flow is disrupted. Curve fitting is performed in two steps: first, a plug flow model is fit to the initial slope (red line) then the entire curve is fit using the hybrid plug and compartment (HyPC) model (blue line).
Bottom Row. The recovered flow-scaled impulse response functions, FR(t), corresponding to the curves in the top row are shown (black lines). For comparison, FR(t) estimated using Tikhonov deconvolution also shown (green lines).