
Figure 3.
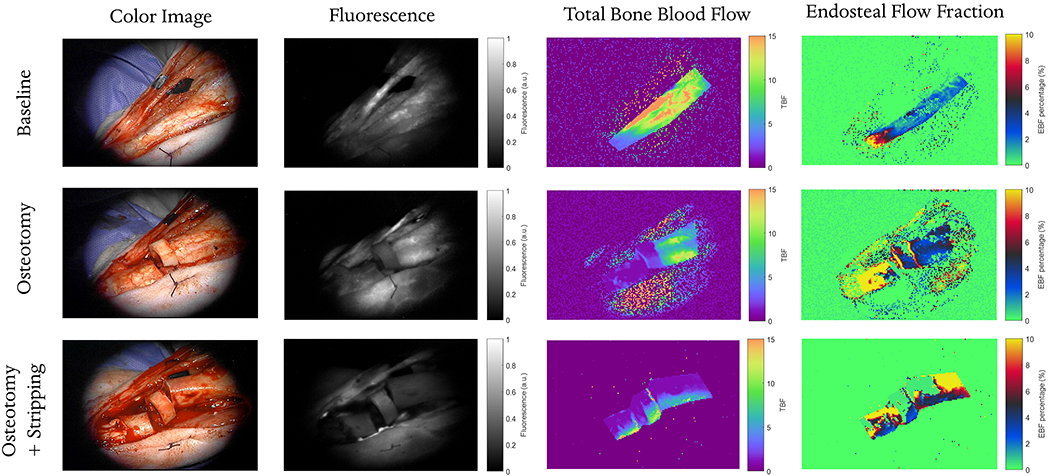
For each leg condition (baseline, osteotomy and osteotomy with full periosteum stripping), four images are shown: a white-light image acquired during surgery with the operating microscope, a fluorescence image acquired at a single time-point 30 s after ICG injection, parametric map of total bone blood flow (TBF) and the percent fraction of endosteal flow (EBF / TBF). Parametric maps are recovered by fitting the HyPC model on a pixel-by-pixel basis.