
Extended Data Fig. 1. Quantitative mass spectrometry analysis of fatty acids biosynthesis liver enzymes.
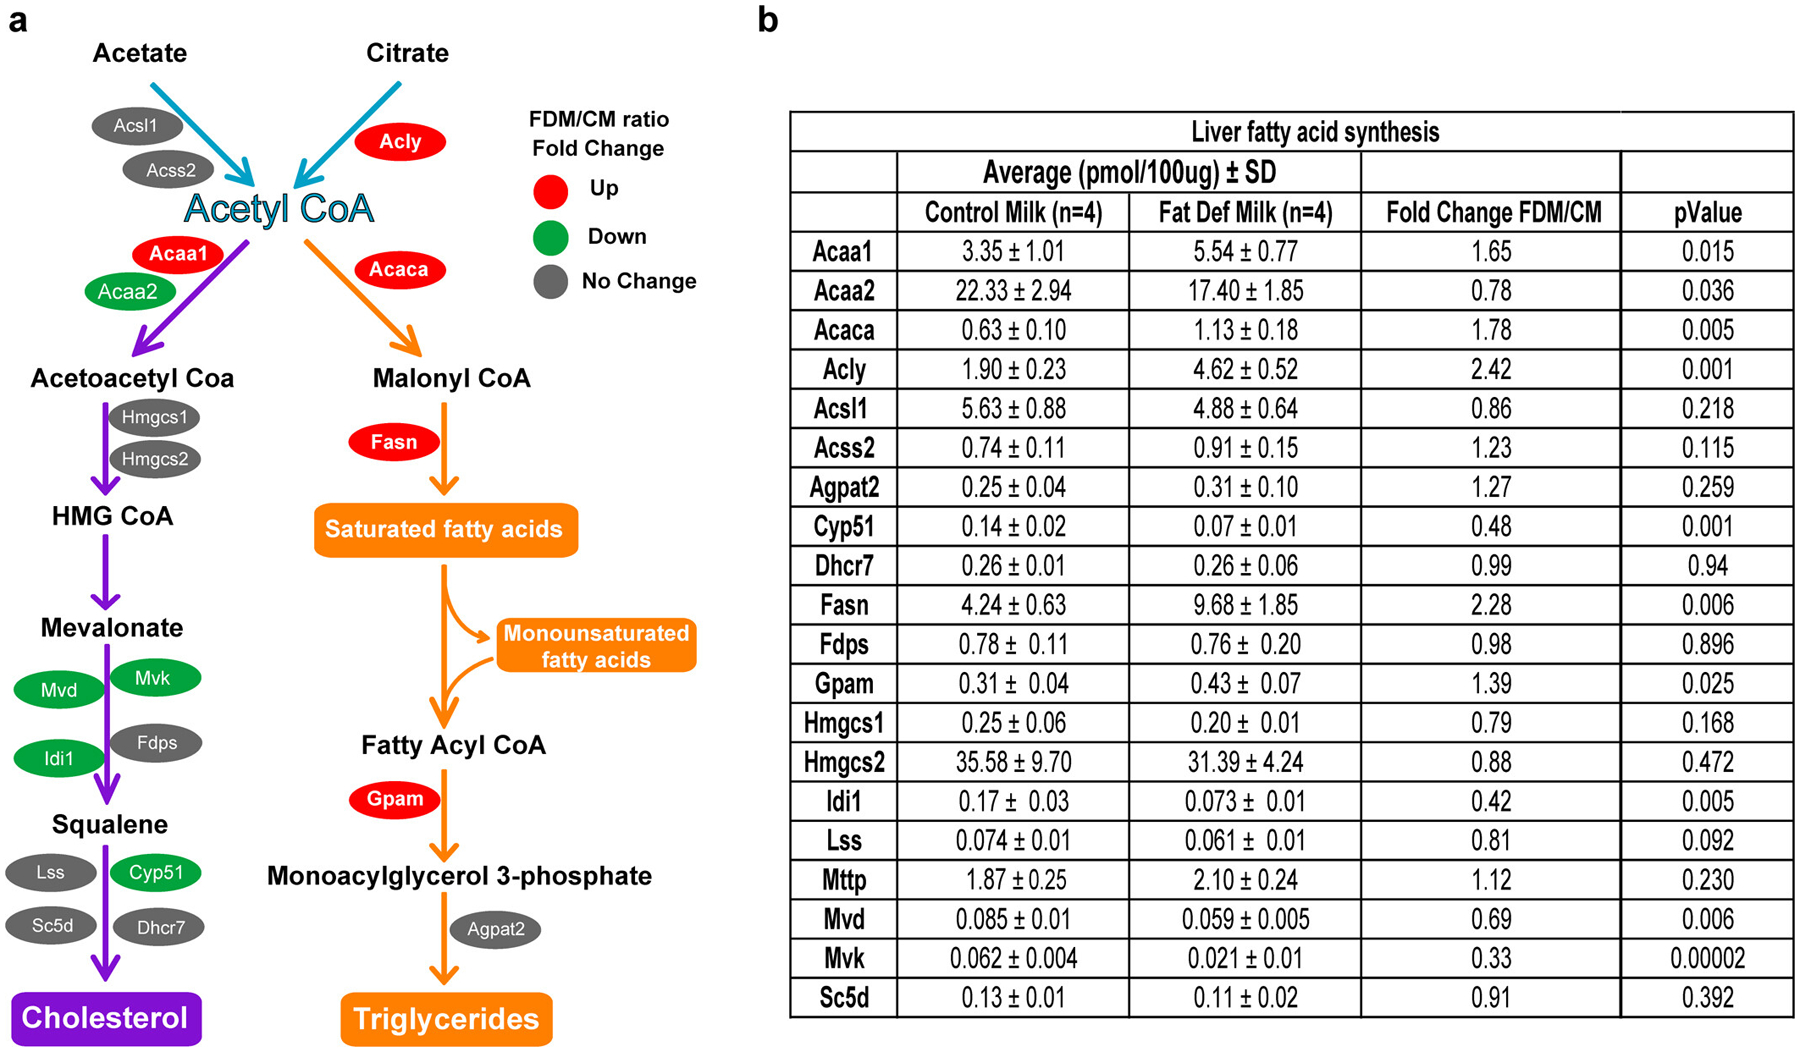
a, Schematic view of cholesterol and triglyceride biosynthesis pathways. Red, green and gray colors represent the upregulated, downregulated and unchanged protein expression, respectively. The analysis shows a significant increase in the enzymes involved in the synthesis of saturated fatty acids and triglycerides in FDM compare to CM mice. Enzymes involved in cholesterol biosynthesis were downregulated in the FDM liver. b, Table showing the average, fold change and p-value of the hepatic enzymes involved in fatty acid biosynthesis, identified by quantitative mass spectrometry between FDM and CM mice (n=4 biologically independent mice per group). CM, control milk group; FDM, fat deficient milk group. Statistical analysis was performed with two-tailed Student’s t-test.