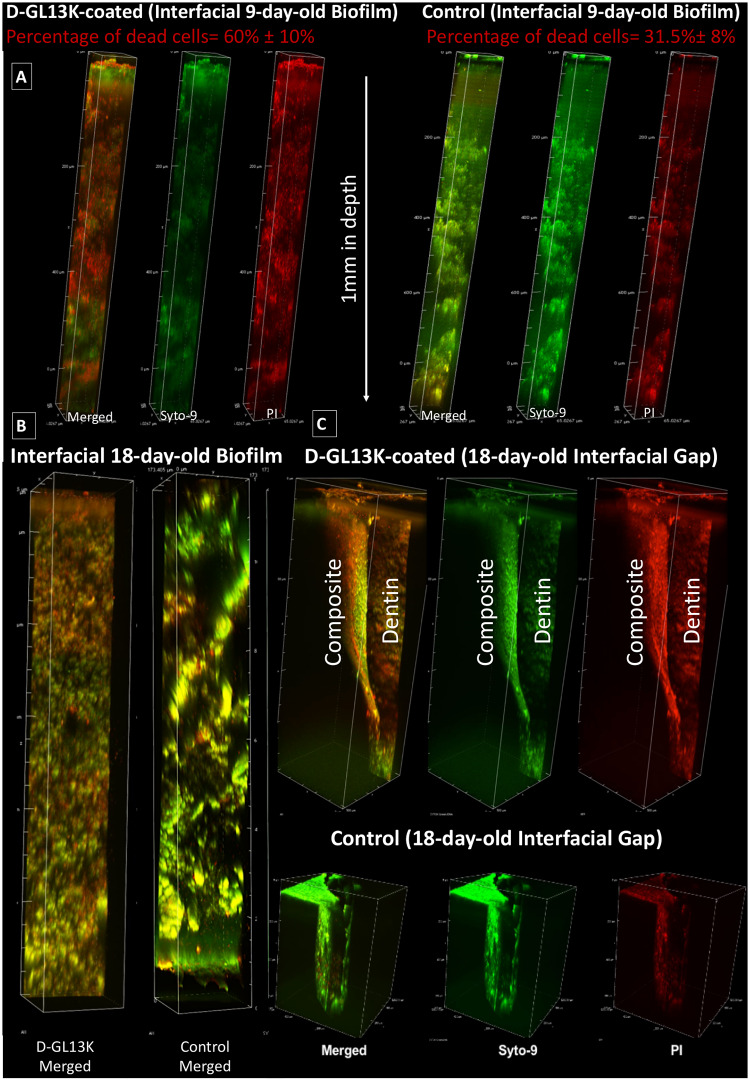
Fig 5. Multiphoton fluorescence 3D rendering of plaque biofilms along dentin-composite interfacial artificial gaps up to 1 mm in depth created as shown in Fig 1.
A) 9-day-old plaque biofilm and B) 18-day-old plaque biofilm along D-GL13K treated (left) and control non-peptide treated (right) interfaces. Quantified dead cells in A) are average percentage values ± standard deviations. C) Zoomed-out images of the 18-day-old plaque biofilm grown at the interfacial gap between dentin and composite restorations. Top panel shows the plaque biofilm response to D-GL13K coated dentin and composite restoration; that is the straight surface and the curved surface of the artificial gap, respectively. Bottom panel shows a control non-coated sample. In A) and C), left channels (red+green = merged live and dead bacteria), central channels (Syto-9, green = live bacteria), and right channels (PI, red = dead bacteria).

