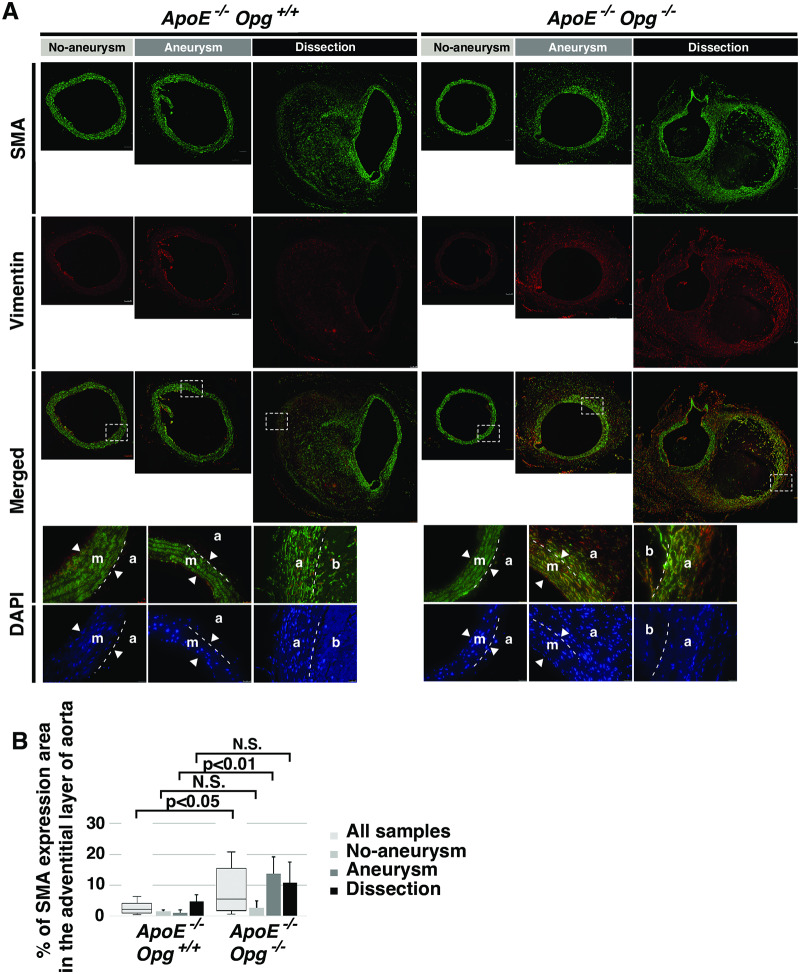
Fig 4. Accumulation of myofibroblasts in adventitias of AngII-infused ApoE-/-Opg-/- mice.
(A) Representative double-immunofluorescence images of aortas after AngII infusion with anti- SMA (green) and anti-vimentin (red) antibodies. Scale bars indicate 100 μm. Areas selected by the white box (dotted line) are magnified below. Nuclei were stained with DAPI (blue). Scale bars indicate 25 μm. Medial layer (m), Adventitial layer (a), hematoma (b). The two arrowheads show borders of the medial layer. The white dotted line in the magnified panels indicates the border of the medial and adventitial layers. (B) Percent area of SMA expression in adventitias of ApoE-/-Opg+/+ (n = 16) and ApoE-/-Opg-/- (n = 16) mice. Measurements for all samples are presented as box plots. Measurements for the three groups are presented as bar graphs. n = 4 and 8 for the No Aneurysm group, n = 5 and 5 for the Aneurysm group, and n = 7 and 3 for the Dissection group in ApoE-/-Opg+/+ and ApoE-/-Opg-/- mice, respectively. Statistical significance: p<0.05.

