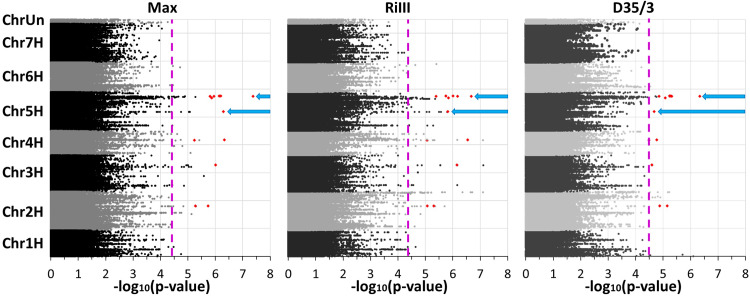
Fig 3. Manhattan plots of the–log10-transformed p-values for Max trait, RiIII, and D35/3 severities.
The significance threshold of -log10 (p-value) = 4.45 is depicted as a pink dotted line and the blue arrows represent the peaks from which the four candidate genes have been selected. The 17 SNPs, which were significantly associated with all three traits, are indicated as red diamonds.

