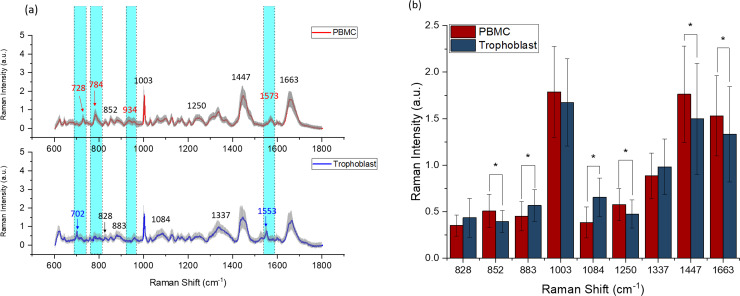
Fig 5. Raman fingerprint of extracellular vesicles (EVs) isolated from peripheral mononuclear blood cells (PBMC) and trophoblast cells.
The solid line indicates the average of 90 spectra ± 1 standard deviation (shaded grey areas). The areas highlighted in cyan color showed the intensity differences. The peaks marked in red only exist in PBMC-derived EVs, while the peaks in blue only exist in trophoblast-derived EVs (a). Mean Raman peak intensity analysis of PBMC and trophoblast-derived EVs, N = 90, * means P < 0.05 (b).

