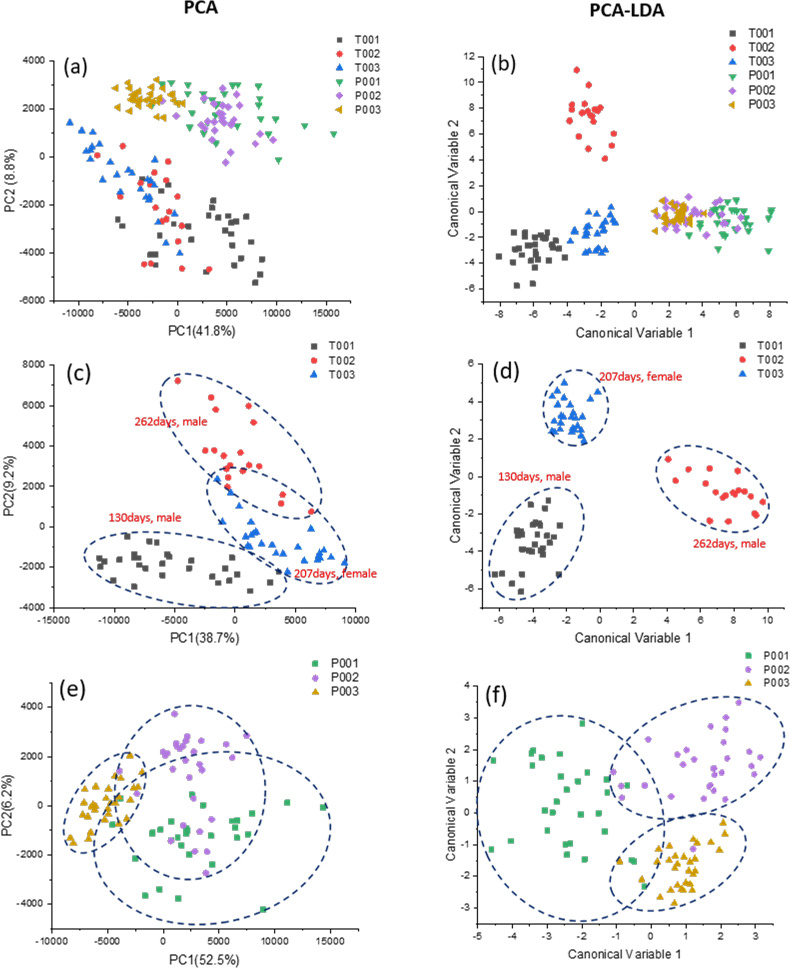
Fig 6. PCA and LDA analyses of the extracellular vesicles derived from peripheral mononuclear blood cells (P001, P002 and P003) and trophoblast cells (T001, T002 and T003).
Scatter plot of the PCA results show the PC1 and PC2 scores assigned to each spectrum (N = 90) (a). Linear discriminant analysis, the first 10 PC loadings calculated by means of PCA were used for LDA. Each spot represents a single spectrum. The crosses indicate the mean canonical observation score obtained for each group (N = 90) (b). 2D PCA (c) and LDA (d) plots of PBMC-derived vesicles from three different cows, and 2D PCA (e) and LDA (f) plots of trophoblast-derived vesicles from three different animal individuals.

