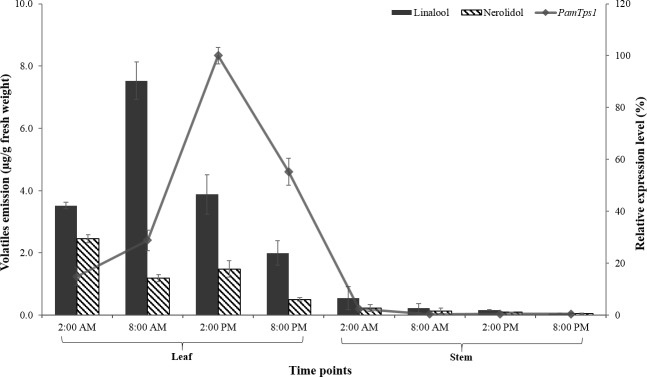
Fig 4. Correlation between linalool and nerolidol emissions and PamTps1 expression in leaves and stems of P. amboinicus within a 24 h day/night cycle.
Relative expression analysis was performed by qRT-PCR using EFG, TUB and APRT as reference genes. The relative transcription level in tissue with the highest expression quantity was set to 1 (100%). Each bar represents the mean value ±SE of three biological and three technical replicates. The linalool and nerolidol emission data presented are means ± SE of duplicate experiments.

