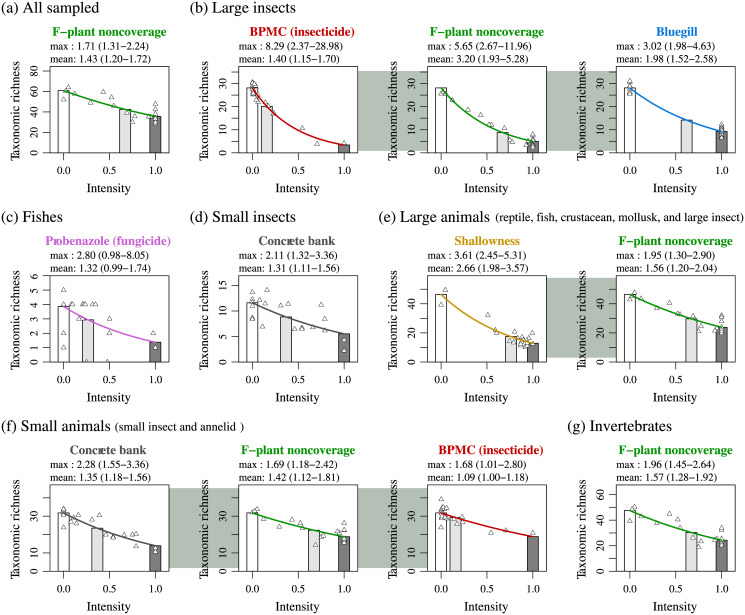
Fig 2. Statistically significant stressors on taxonomic richness of all-sampled category and its subcategories: Large insects (Coleoptera, Ephemeroptera, Hemiptera, Lepidoptera, Odonata, and Trichoptera), fishes, small insects (Diptera), large animals (reptiles, fishes, mollusks, crustaceans, and large insects), small animals (small insects and annelids), and invertebrates (mollusks, crustaceans, large insects, small insects, and annelids).
In each panel, the white bar indicates the expected taxonomic richness of the focal animal category in the absence of all statistically contributive stressors (R in Eq. (S2.10) in S2 Appendix 8). The light gray (or dark gray) bar indicates the expected taxonomic richness in the presence of only the focal stressor denoted by xj at its mean intensity (or maximum intensity, scaled to 1.0) among the studied ponds, given by (or R exp(βj)) with its regression coefficient βj in the contracted best model. The value labeled with “mean” (or “max”) shows the mean (or maximum) impact of the focal stressor among ponds, given by the height ratio of the white bar to the light gray bar (or dark gray bar). Specifically, the mean (or maximum) impact was calculated as (or exp(−βj)). (See S2 Appendix 8 for details). The estimation errors were calculated as Wald 95% confidence intervals, indicated in the format of (lower bound—upper bound). The solid curve indicates the expected taxonomic richness as a function R exp(βjxj) of the focal stressor’s intensity xj. The scatter plots indicate R exp(βjxj,i) + εi, where xj,i is the intensity of the focal stressor at the ith pond, and εi is the fitting residual of the contracted best model for the ith pond.

