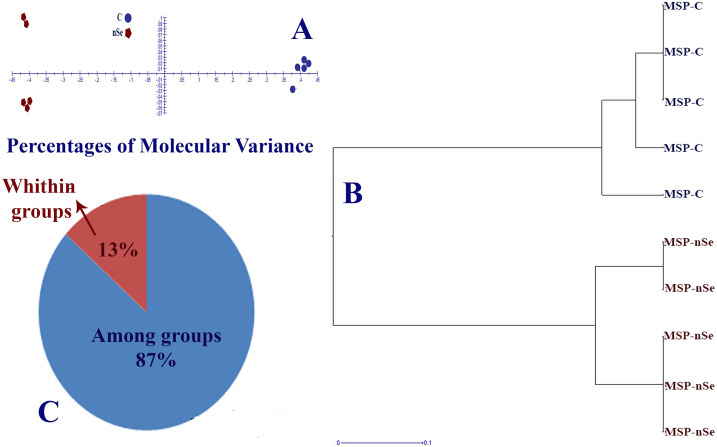
Fig 5. MSAP-based variation in DNA methylation patterns of bitter melon in response to the incorporation of nSe at 0 (control) and 30 mgL-1 into the MS culture medium.
(A) Principal coordinates analysis (PCoA) plots of variation in DNA methylation under EcoRI/Msp I conditions. (B) Clustering dendrogram based on DNA methylation variation between control, and nSe treatment group. (C) Percentage of molecular variance within and among treatment groups.

