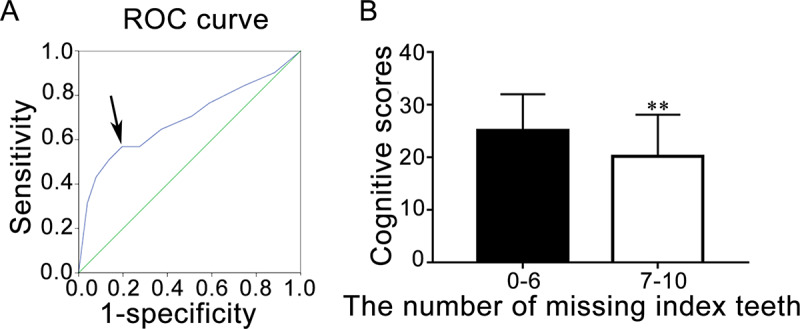
Fig 1. Number of missing index teeth and cognitive scores.

(A) ROC curve. The arrow indicates the cut-off point for grouping of the number of missing index teeth. (B) Grouping of the number of missing index teeth and cognitive scores. Data are presented as mean ± SD (n = 102); ** P < 0.01, vs. 0–6, Student’s t-test.
