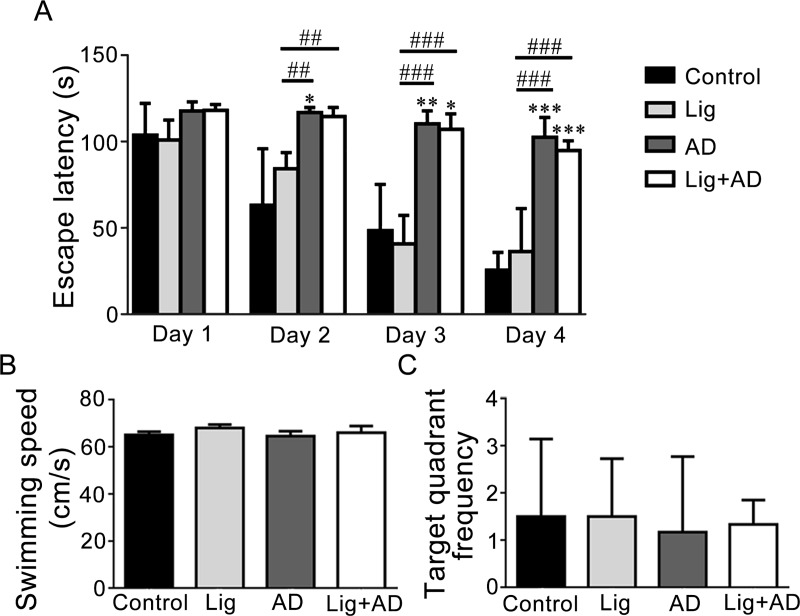
Fig 3. MWM results.
(A) Escape latency to reach the hidden platform from days 1 to 4. (B) Swimming speed of the rats. (C) Target quadrant crossover frequency. Data are presented as mean ± SD (n = 6). *P < 0.05, **P < 0.01, ***P < 0.001 vs. control, ##P < 0.01, ###P < 0.001 vs. other groups, one-way ANOVA.

