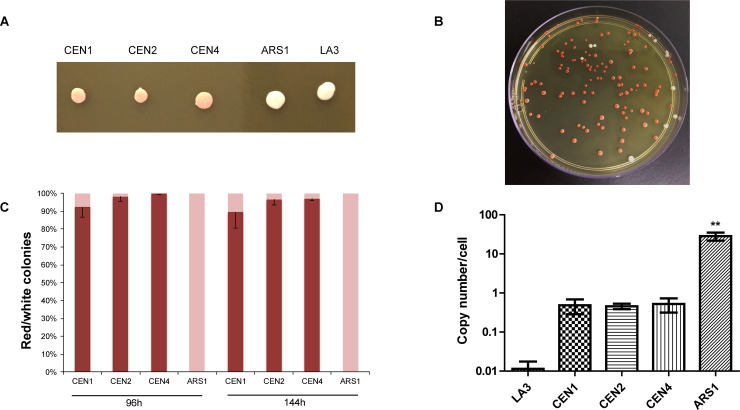
Fig 4. Plasmid stability and copy number analyses of the LA3 strain transformed with pPICH-CEN1 (CEN1), pPICH-CEN2 (CEN2), pPICH-CEN4 (CEN4), and pPICH-ADE3 (ARS1).
(A) Representative colonies of each of the transformations and of the LA3 strain on YPD medium. (B) Plate representing a typical result of the plasmid stability analysis. Aliquots of three liquid cultures for each plasmid construction were collected and diluted after 96 and 144 h of growth; the dilutions were plated on YPD medium. (C) Proportions between red and white colonies obtained at each timepoint. Red colonies obtained in the plasmid stability plates are represented by red portions of the bars; light pink bars represent white colonies. Statistical analyses comparing the centromeric plasmids with each other were performed through unpaired t-tests with Welch’s correction for unequal variances using GraphPad Prism 5. Error bars represent the standard deviation of the mean (n = 3 biological replicates). (D) Plasmid copy number determination by quantitative PCR (qPCR). LA3 was used as negative control. Statistical analyses comparing each of the centromeric plasmids with the replicative vector were performed through unpaired t-tests with Welch’s correction for unequal variances using GraphPad Prism 5 (p<0.005). Error bars depict the standard deviation of the mean (n = 3 biological replicates).

