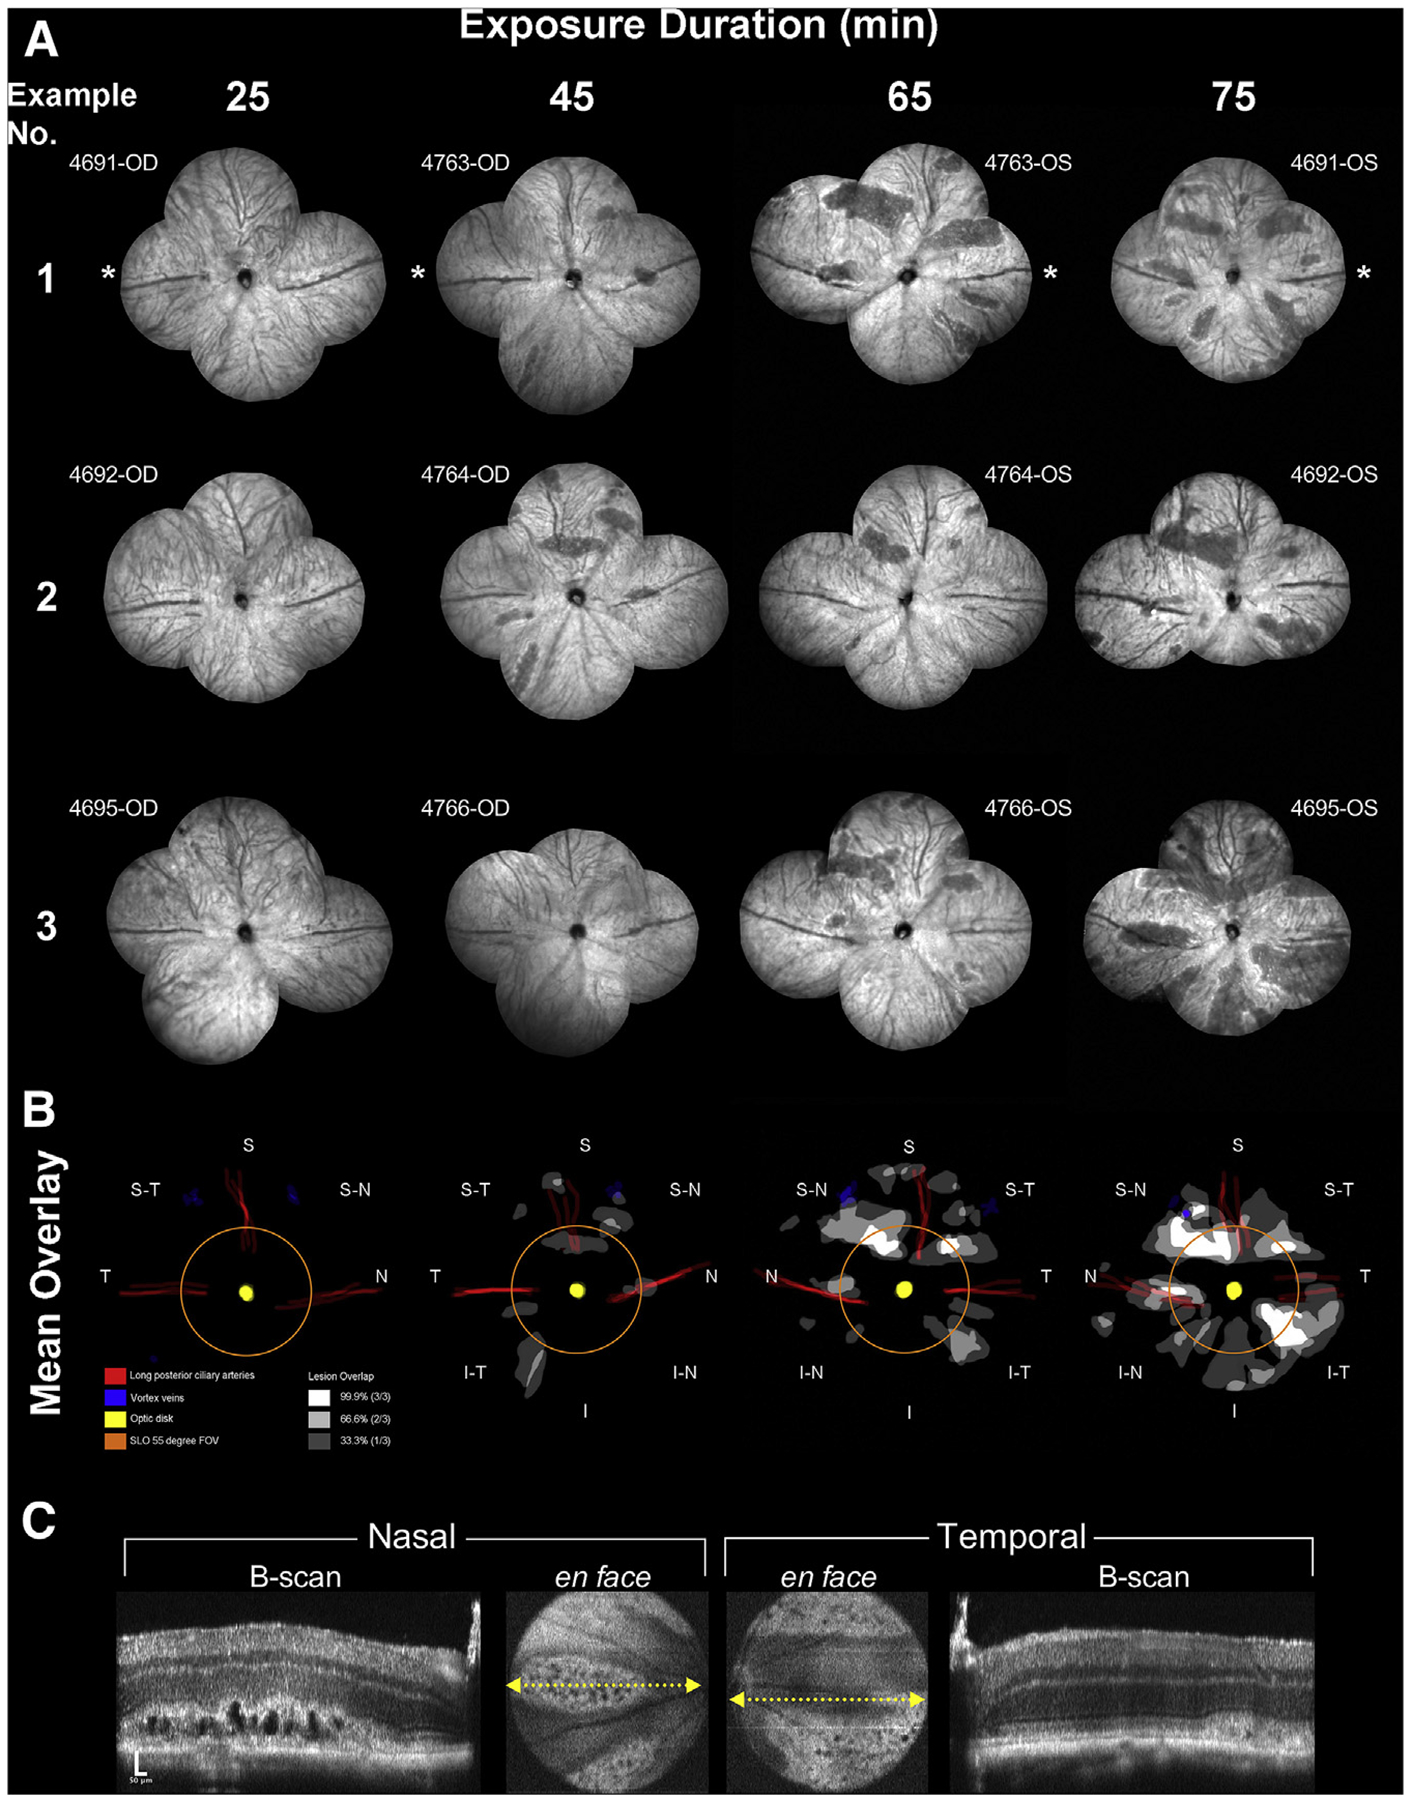
Fig. 2. Montaged fundus views and results from the interrupted exposure time point experiments.

The extent of the induced abnormalities at 3 days post-EPIP can be seen in three examples provided for each interruption time point (A). These examples represent 12 individual eyes from 6 Tulp1+/+ mice. Asterisks indicate the temporal region. No abnormalities are visible at 25 min whereas the number and size of the lesions can be seen increasing with more prolonged exposure duration. Lesion involvement overlays were created for each retina example that also included demarcating the location of the vortex veins, optic disk, and long posterior and superior ciliary arteries. Mean overlays of lesion involvement were created to identify lesion development hot spots related to retinal quadrant (B). As observed, lesions occur in various regions of the posterior pole and in particular, within specific lanes or zones within those regions. The orange ring shows the extent of FOV for the SLO 55° wide-field lens. Note that many lesions form outside this central retina FOV, which is reasonably conserved among commercially available color fundus, SLO and SD-OCT imaging instruments capable of imaging mice. (C) SD-OCT images from the horizontal meridian of the mouse (#4695-OS) from Fig. 2A IRDF-SLO example #3 @ 75 min Post-EPIP recovery time showing the prominent formation of large vacuoles or cyst-like structures within the photoreceptor layer.
