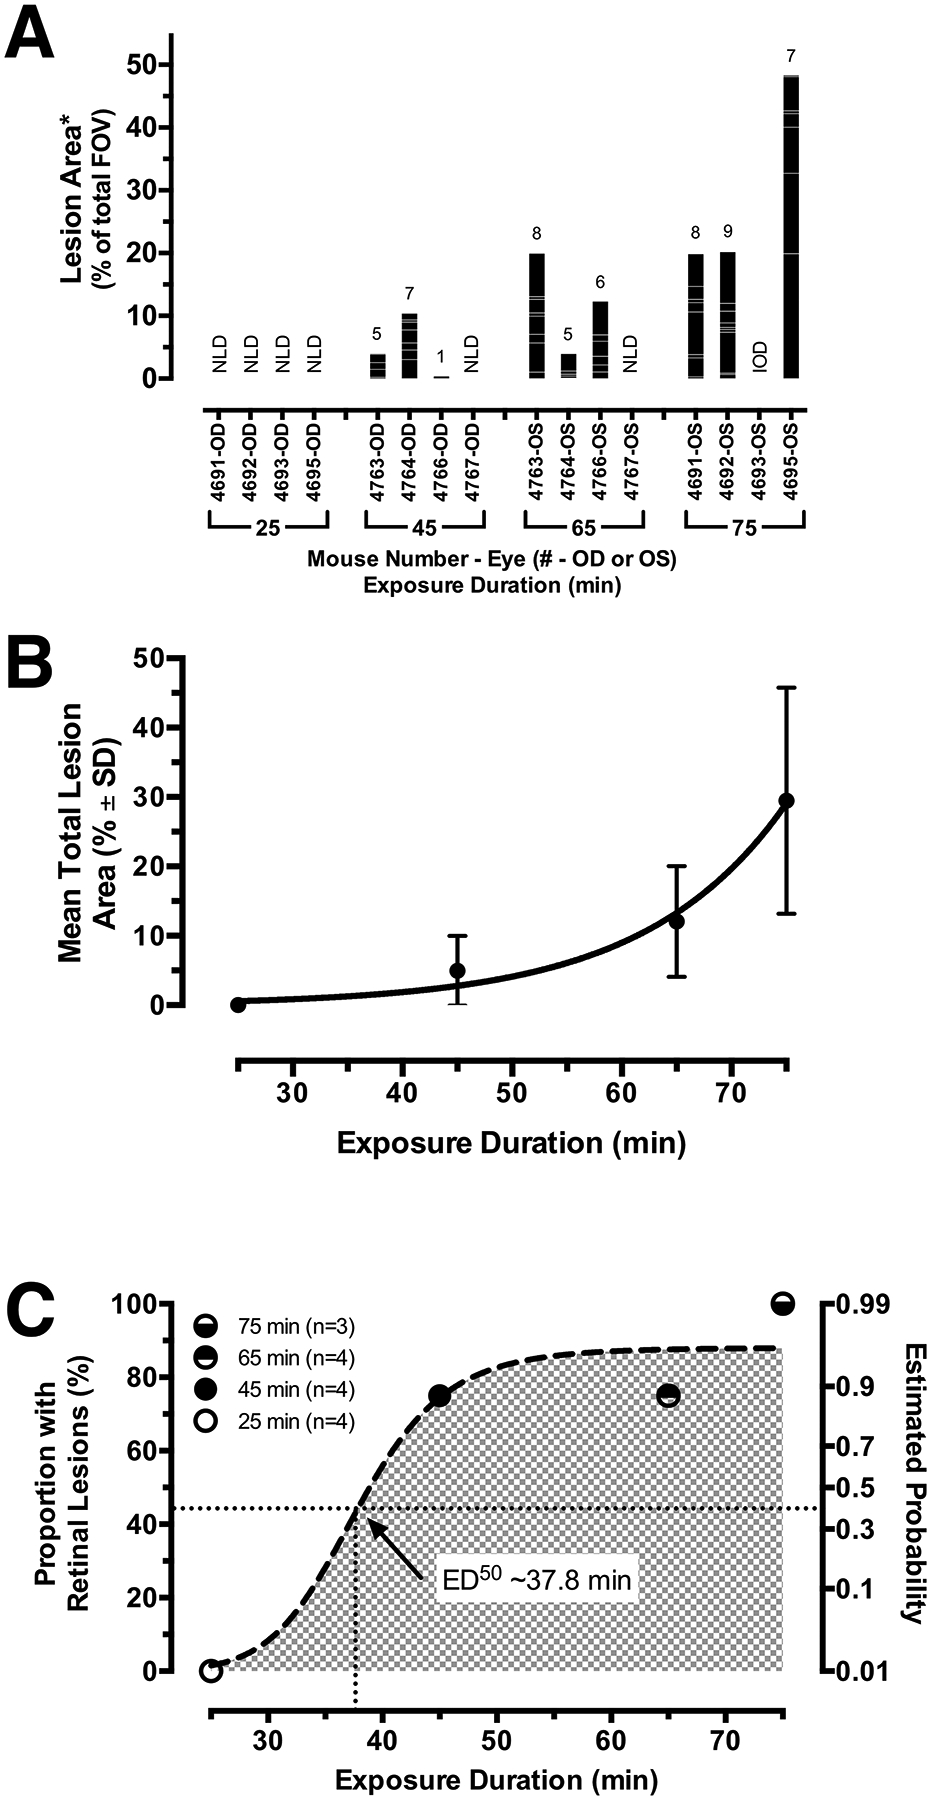
Fig. 3. -. Quantified Results from the Interrupted Experiments.

(A) Data obtained from the IRDF-SLO images shown in Fig. 2A of eyes that underwent interrupted recovery protection at 25, 45, 65, and 75 min post-EPIP. A stacked bar graph indicates eyes from Tulp1+/+ mice (n = 8) exhibiting lesions (columns) along with the numbers of individual lesions counted (number of stacked intracolumn bars; total # provided above column), the areas of each individual lesion (individual intracolumn bar height), and the collective areas of all individual lesions observed per eye (column height). Abbreviations: NLD-no lesions detected, IOD-irreversible ocular damage. (B) The mean total lesion area for affected eyes (mean ± SD.) fitted with an exponential growth curve (Adjusted R2 = 0.98). (C) Effective dose time-response curve generated from the proportion of eyes found with lesions and the estimated probability of retinal lesions. This trend underscores that eyes cannot be left unprotected for more than ½ hour before the risk of developing retinal lesions begin. Note that the curve is steep and shows that the mice transition from moderate (50%) to high risk (> 90%) within 10 min beyond the ½ hour exposure mark.
