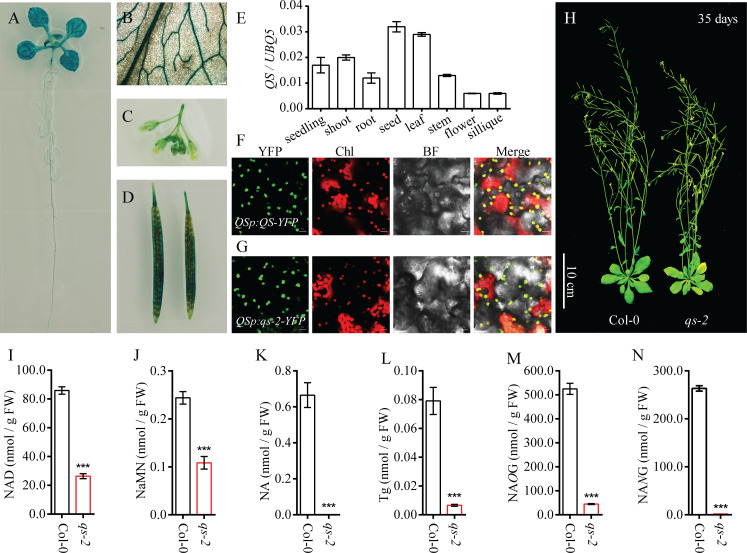
Fig 2. Characterization of the QS gene in Arabidopsis.
(A—D) The expression pattern of the QS gene analyzed by promoter-GUS analysis. Histochemical staining of 10-day-old seedling (A), rosette leaf (B), flower (C) and silique (D) of the QSpro:QS-GUS transgenic plants. (E) The expression of QS in different tissues determined by qRT-PCR. Values are means ± SD (n = 3). (F, G) Subcellular localization of QS-YFP and qs-2-YFP fusion proteins. The YFP signals in the transgenic plants harboring the QSpro:QS-YFP (F) and QSpro:qs-2-YFP (G) were observed using confocal microscopy. YFP, yellow fluorescence protein. Chl, chlorophyll autofluorescence. BF, bright field. Bars, 10 μm. (H) Growth phenotypes of Col-0 and qs-2 mutant plants in soil for 35 days. Bars, 10 cm. (I—N) Analysis of the metabolites in the rosette leaves of Col-0 and qs-2 mutants. The contents of NAD (I), NaMN (J), NA (K), Tg (L), NAOG (M), and NANG (N) were determined in the rosette leaves of Col-0 and qs-2 plants grown in 1/2 MS for 3 weeks. The data represent the means ± SD (n = 5). Asterisks indicate significant differences from the Col-0 plants, *** P < 0.001, Student’s t-test.

