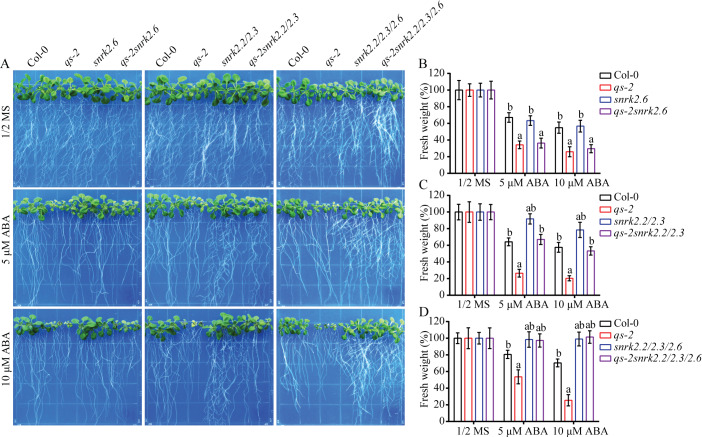
Fig 5. Genetic interaction between QS and SnRK2s in plant growth response to ABA.
(A) Genetic relationship between qs-2 and SnRK2.2/2.3/2.6 mutations in response to ABA treatment. The images shown were 5-day-old Col-0, qs-2, snrk2.6, qs-2snrk2.6, snrk2.2/2.3, qs-2snrk2.2/2.3, snrk2.2/2.3/2.6, and qs-2snrk2.2/2.3/2.6 seedlings grown on 1/2 MS plates supplemented with 0, 5 or 10 μM ABA for 8 days. (B—D) The fresh weight of the seedlings shown in (A). Values are means ± SD of 3 replicates, and each replicate contained 9 plants per line. The letters a and b above the columns indicate significant difference relative to Col-0 and qs-2 mutant, respectively (P < 0.05, Student’s t-test).

