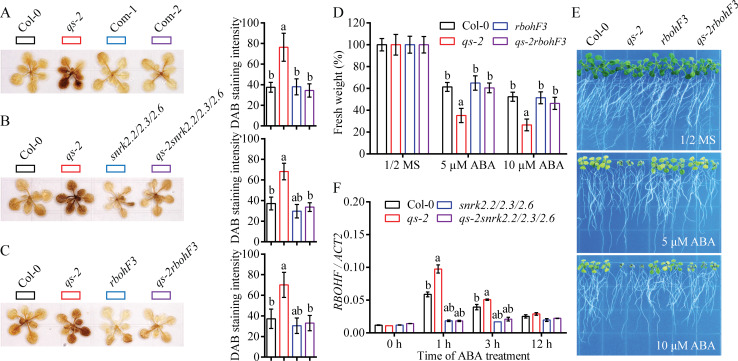
Fig 6. ROS over-accumulation in the qs-2 mutant requires SnRK2s and RBOHF.
(A—C) DAB staining showing H2O2 accumulation in the rosette leaves. Twenty-day-old Col-0, qs-2, Com-1 and Com-2 plants after ABA treatment for 1 day (A). Twenty-day-old Col-0, qs-2, snrk2.2/2.3/2.6, and qs-2snrk2.2/2.3/2.6 plants were subjected to 10 μM ABA treatment for 1 day before DAB staining (B). Twenty-day-old Col-0 wild-type, qs-2, rbohF3, qs-2rbohF3 plants after 10 μM ABA treatment for 1 day (C). The DAB staining intensity as determined by ImageJ. The letters a and b above the columns indicate significant difference relative to Col-0 and qs-2 mutant, respectively (n = 5 plants, six leaves per plant, P < 0.05, Student’s t-test). (D) Genetic relationship between qs-2 and rbohF mutations. Five-day-old seedlings of Col-0, qs-2, rbohF3, and qs-2rbohF3 were grown on 1/2 MS supplemented with 0, 5 or 10 μM ABA for 8 days. (E) The fresh weight of the seedlings shown in (D). Values are means ± SD (n = 3 biological replicates, and each replicate contained 9 plants per genotype). The letters a and b above the columns indicate significant difference relative to Col-0 and qs-2 mutant, respectively (P < 0.05, Student’s t-test). (F) The transcript levels of RBOHF determined by qRT-PCR in 10-day-old Col-0, qs-2, snrk2.2/2.3/2.6, qs-2snrk2.2/2.3/2.6 plants after ABA treatment for the indicated hours. The letters a and b above the columns indicate significant difference relative to Col-0 and qs-2 mutant, respectively (n = 3, P < 0.05, Student’s t-test). ACT2 was used as an internal control.

