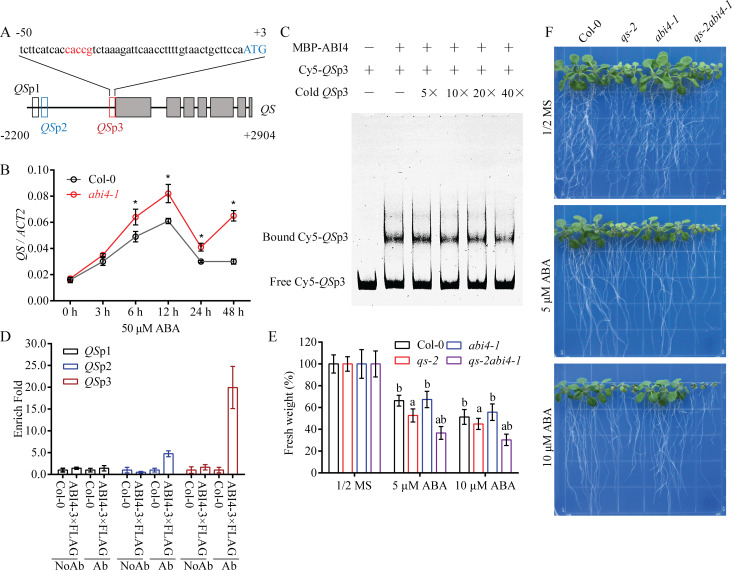
Fig 7. ABI4 negatively regulates QS gene expression.
(A) Schematic diagram of the QS gene. The predicted ABI4-binding sequence CE1 motif is highlighted in red. The gray boxes denote the exons. The red box indicates the predicted ABI4-binding region with the CE1 motif. The black and blue boxes are the QS promoter regions used as controls in the assay. (B) The transcript levels of QS in Col-0 and abi4-1 in response to ABA treatment. Ten-day-old seedlings were subjected to 50 μM ABA treatment for 0, 3, 6, 12, 24 or 48 h. The values represent the means ±SD (n = 3 repeats). * P < 0.05, Student’s t-test. ACT2 was used as an internal control. (C) Electrophoretic mobility shift assay showing the binding activity of the recombinant ABI4 protein to the QS promoter. The assay was performed using the indicated Cy5-labeled probes and 5×, 10×, 20× or 40× unlabeled competitors. (D) ChIP assay of the binding of ABI4 to different promoter regions of QS. The chromatin was extracted from 12-day-old seedlings of 35S:ABI4-3×FLAG transgenic plants and Col-0. Relative enrichment was calculated as the value of the amplified signal normalized against that of the input. Error bars indicate ± SD of three replicates. (E) Genetic relationship between QS and ABI4. Five-day-old seedlings of Col-0, qs-2, abi4-1, and qs-2abi4-1 grown on 1/2 MS medium supplemented with 0, 5 or 10 μM ABA for 8 days. (F) The fresh weight of the seedlings shown in (E). Values are means ± SD of 3 replicates, and each replicate included 9 plants per genotype. The letters a and b above the columns indicate significant difference relative to Col-0 and qs-2 mutant, respectively (P < 0.05, Student’s t-test).

