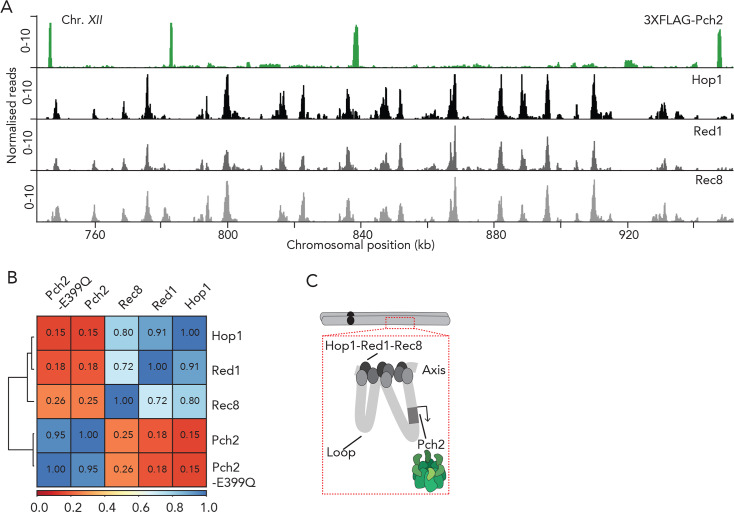
Fig 2. Pch2 and meiotic axis sites.
A. Genome browser view representative images (RPKM; see also Material and Methods) of ChIP-seq binding patterns for 3XFLAG-Pch2, Hop1, Red1 and Rec8. Data for Hop1, Red1 and Rec8 are from [9]. Shown is a region of Chromosome XII (chromosomal coordinates (kb) are indicated). B. Hierarchically clustered heatmap based on correlation coefficients using from 3XFLAG-Pch2-E399Q ChIP-seq datasets as inputs. Hop1, Red1 and Rec8 ChIP-Seq datasets are from [9]. Spearman’s correlation values are indicated. C. Model depicting the proposed localization pattern of Pch2 on loops, within the meiotic chromosome loop-axis structure.

