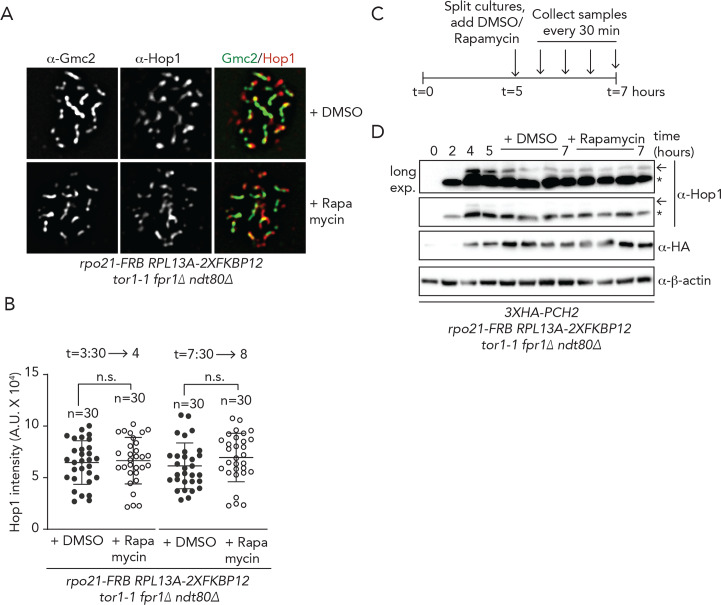
Fig 5. Functional analysis of the transcriptional-associated Pch2 chromosomal population.
A. Representative images of immunofluorescence of Hop1 on meiotic chromosome spreads in rpo21-FRB anchor away cells, treated with DMSO or rapamycin, using the regimen indicated in Fig 3C. Chromosome synapsis was assessed by α-Gmc2 staining. B. Quantification of total Hop1 intensity per spread nucleus for the experiment shown in A and S9D Fig. n.s. (non-significant) indicates p>0.05, Mann-Whitney U test C. Schematic of treatment regimens used for anchor away experiment, as shown in D. D. Western blot analysis of Hop1 and Pch2 (α-HA) in rpo21-FRB anchor away ndt80Δ cells synchronously progressing through meiotic prophase, treated with DMSO or rapamycin, as indicated above the western blot image. Upon DMSO or rapamycin treatment samples were taken every 30 minutes. Arrow indicates phosphorylated Hop1, * indicates non-phosphorylated Hop1. See quantification of three independent western blot experiments on S4 Table.

