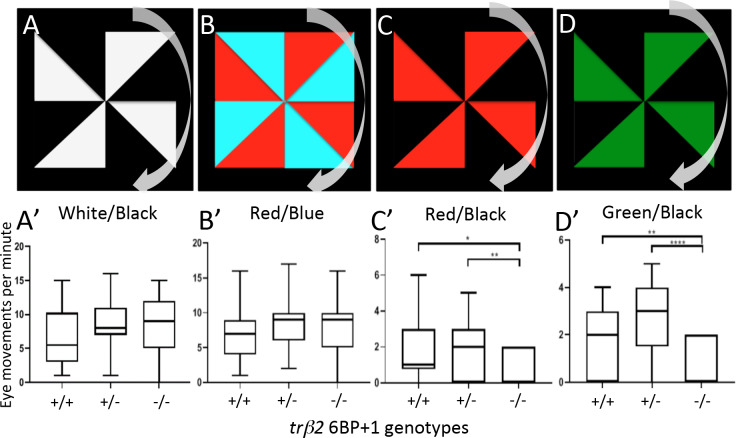
Fig 13. Optokinetic response tests.
(A, B, C, D) Each larva at 9 dpf was exposed to these four stimuli in left to right order. The pinwheel patterns moved clockwise. (A’, B’) The wild type, 6BP+1 heterozygote, and 6BP+1 mutant responded similarly to the white/black and red/blue stimuli. (C’, D’) The mutant had significantly less eye movements in response to the red/black and green/black stimuli. There was one repetition for each wild type (N = 30), heterozygote (N = 37), and mutant (N = 19) larvae. Monitor peak wavelengths are red (~610 nm), green (~550 nm), and blue (~450 nm). Significance is calculated with Mann-Whitney U test.

