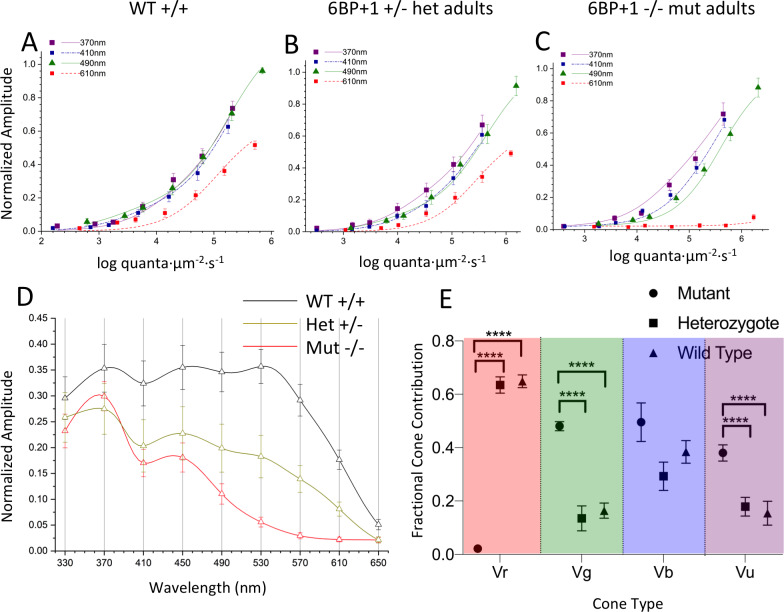
Fig 15. Spectral analysis of 6BP+1 adults.
(A, B, C) The irradiance plots for each genotype showed the loss of response to 610 nm in the mutant regardless of brightness. (D) The spectral plot showed a significant loss of amplitude in the heterozygote (N = 9) and mutant (N = 12) at long wavelengths compared to the WT (N = 11). (E) The mutant shows loss of Vr, increase in Vg, and increase in Vu.

