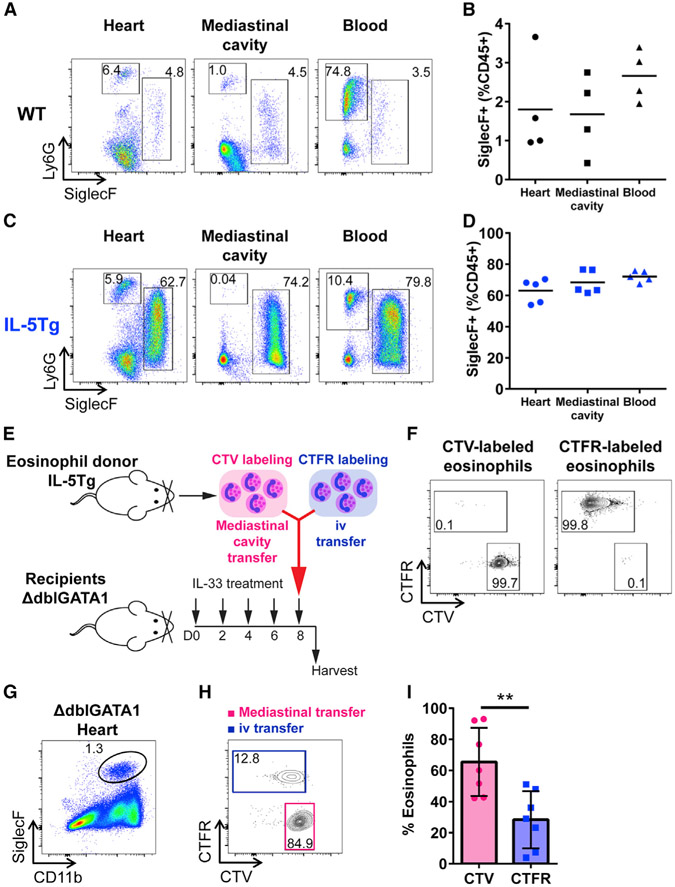
Figure 6. Eosinophils Reside in the Mediastinal Cavity from Which These Cells Can Traffic to the Heart.
(A) Representative flow cytometry plot of CD45+CD11b+ cells. Gates show CD11b+SiglecF+ eosinophils and CD11b+Ly6G+ neutrophils in the heart, mediastinal cavity, and blood of WT naive mice.
(B) Frequency of eosinophils in the heart, mediastinal cavity, and blood of WT naive mice.
(C) Representative flow cytometry plot of CD45+CD11b+ cells. Gates show CD11b+SiglecF+ eosinophils and CD11b+Ly6G+ neutrophils in the heart, mediastinal cavity, and blood of IL-5Tg naive mice.
(D) Frequency of eosinophils in the heart, mediastinal cavity, and blood of IL-5Tg naive mice.
(E) Schematic description of eosinophil transfer to eosinophil-deficient ΔdblGATA1 mice.
(F) Flow cytometry plots of CTV- or CTFR-labeled eosinophils.
(G) Flow cytometry plot of CD45+ cells in the heart. Gate shows CD11b+SiglecF+ eosinophils found in the heart of ΔdblGATA1 mice treated with IL-33 after eosinophil transfer in the mediastinal cavity and i.v.
(H) CTV- or CTFR-labeled CD11b+SiglecF+ eosinophils found in the heart of ΔdblGATA1 mice treated with IL-33 after eosinophil transfer.
(I) Frequency of CTV- or CTFR-labeled eosinophils found in the heart of ΔdblGATA1 mice treated with IL-33.
Concatenated samples (n = 7) are shown in (G) and (H). Both male and female mice were used in (G)–(I). Data are representative of two independent experiments and displayed as the mean (B and D) or the mean with SD (I). One-way ANOVA followed by Tukey’s post hoc test (B and D) or unpaired t test (I) was used for statistical analysis. **p < 0.01.
See also Figure S6.

