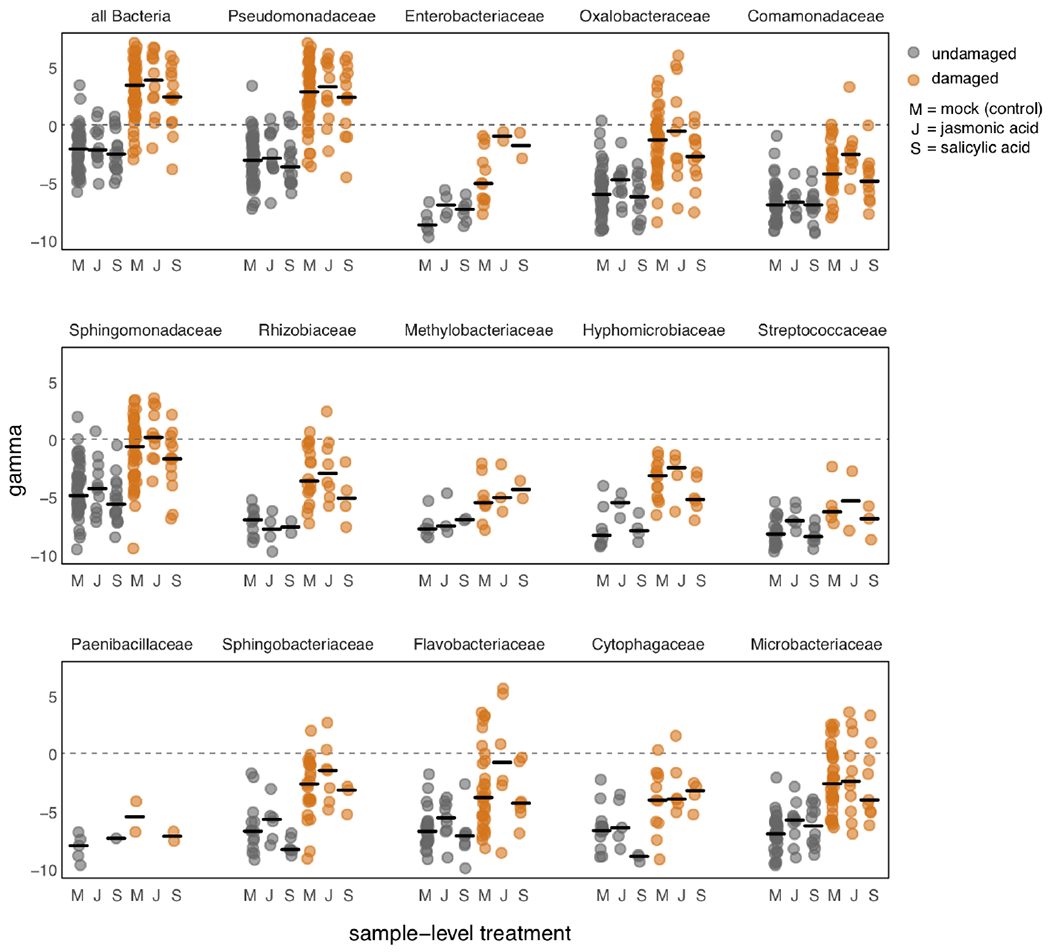
Extended Data Fig. 4. Hormone pre-treatment (Mock, JA, or SA) five weeks prior to sampling does not leave a clear signature in the distribution of γ across samples for undamaged (gray) or herbivore damaged (orange) leaf samples.

For each of the 14 most abundant bacterial families, in addition to all Bacteria, we have plotted the distributions of raw γ for damaged and undamaged samples across mock-(M), JA-, or SA-treated plant patches. Black bars represent medians for the respective distribution, and data points are slightly jittered along the x-axis. Systematic differences in γ can be easily seen between damaged versus undamaged sample classes, whereas no systematic differences can be seen between the different hormone treatment classes within each damage class. If any effects of hormone treatments are indeed present, they do not constitute a discernible feature of these data, supporting the choice to devote minimal attention to this aspect of our experiment.
