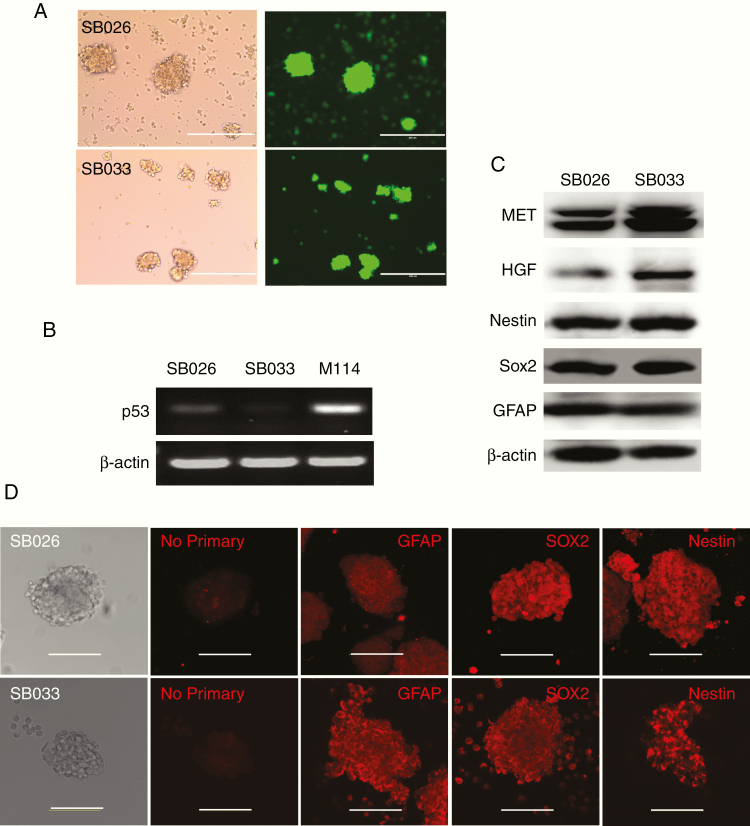
Figure 4.
Characterization of neurospheres derived from SB-huHgf.Met.Shp53 tumors. (A) Representative image showing SB-026 and SB-033 forms tumor spheres that are GFP positive. Scale bar refers to 400 µm. (B) p53 mRNA levels in SB-026, SB-033, and M114 cells as determined by RT-PCR. (C) HGF, MET, GFAP, Nestin, and SOX2 expression levels in SB-026 and SB-033 as determined by Western blot. (D) GFAP, Nestin, and SOX2 expression levels in SB-026 and SB-033 as shown by confocal microscopy. Scale bar refers to 100 µm. A “No primary” control was included to indicate the background staining due to secondary antibody alone.

