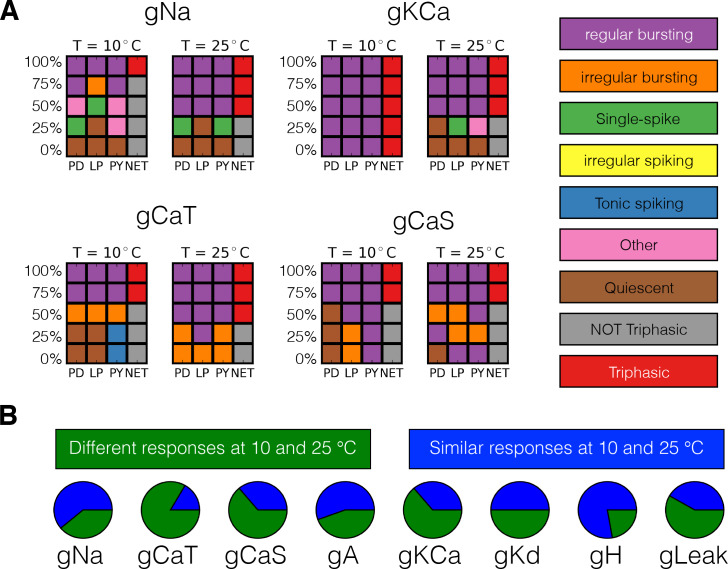
Figure 10. Classification of responses at different temperatures.
The models’ responses to perturbations are diverse and are in general different at different temperatures. We classified the responses of the models at two temperatures for five values of gradual decrements of each current. (A) Response to removal of , , and currents for one model. (B) The pie charts show the number of models for which the responses to complete removal (0%) are classified as the same (green) or different (blue) at 10°C and 25°C.

