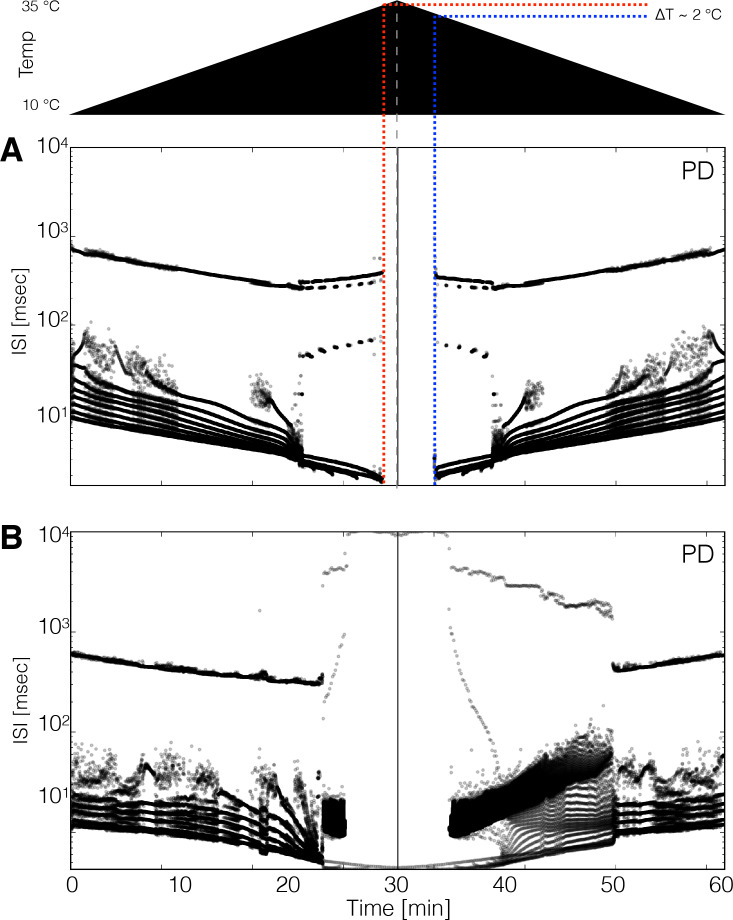
Figure 8. Hysteresis and multistability.
Temperature was increased from 10°C to 35°C and then decreased back to 10°C symmetrically. (Top) Schematic representation of the temperature ramp. Panels A and B show the ISI distributions of the cell over time for two different models. (A) The cell ceases to produce spikes before 600 s, which is also before reaching 35°C, and remains quiescent until temperature is ramped down. The temperature at which the cell resumes spiking is ≈ 2°C lower than the temperature at which it became quiescent, indicating that the system is multi-stable over that temperature range. (B) Hysteresis is more evident in this model. The spiking patterns during the down ramp differ visibly from those during the up ramp over a wide temperature range.

