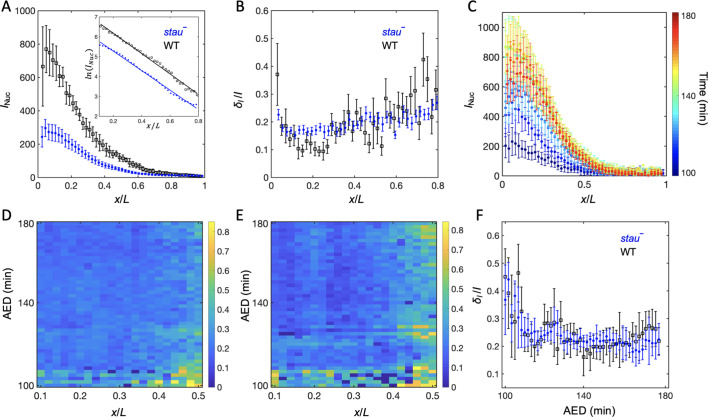
Figure 2. The Bcd gradient noise of stau– mutants is comparable with that of the WT.
(A) The average intensity of the nuclear Bcd-GFP gradient of stau– mutants (blue) and the WT (black) as a function of the fractional embryo length at 16 min into nc14. Each circle and error bar represents the average and standard deviation, respectively, of the Bcd-GFP fluorescence intensity of the nuclei in the bin with a bin size of 2% EL. The inset shows the logarithm of the intensity as a function of the fractional embryo length and the linear fit in the range of 0.1–0.8 EL. (B) The relative Bcd-GFP gradient noise of stau– mutants (blue) and the WT (black). Each circle represents the standard deviation divided by the mean of the Bcd-GFP fluorescence intensity of the nuclei in the bin with a bin size of 2% EL. The error bar represents the standard deviation of the mean relative gradient noise calculated with bootstrap. (C) Variation in the average profiles of the Bcd gradient in stau– mutants from nc12 to 50 min into nc14. (D, E) The heat map of the Bcd gradient noise of the WT (D) and stau– mutants (E) from nc12 to 50 min into nc14. (F) The average Bcd gradient noise of stau– mutants from x = 0 to x = 0.55 EL versus developmental time is comparable with that of the WT.


