. 2020 Jun 8;9:e54276. doi: 10.7554/eLife.54276

Figure 4. The dynamic shift range of the position of Kr and Eve is smaller than that of Hb in stau mutants.

(A) The positions of the anterior boundary (inflection point) of Kr (solid triangle) and xHb (hollow triangle) with the stau mutants (blue) and the WT (black). (B) The peak of Eve in stau mutants (blue) as a function of the developmental time in nc14 in comparison with that in the WT (black).

Figure 4—source data 1. Source data for Figure 4.

Figure 4.

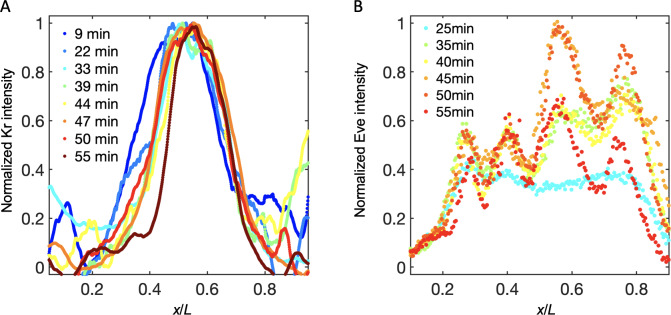
Figure 4—figure supplement 1. Measurement results of Kr and Eve in stau mutants.

Figure 4—figure supplement 1.

(A, B) Dynamics of the Kr (A) and Eve (B) profiles in nc14.
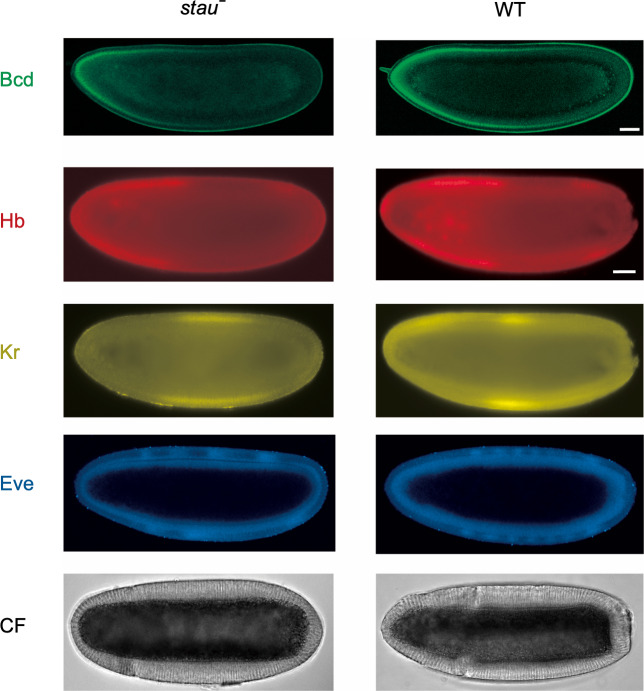
Figure 4—figure supplement 2. Representative raw images of Bcd-GFP, Hb, Kr, Eve, and CF of the WT and stau mutants.

Figure 4—figure supplement 2.

Representative raw images of Bcd-GFP (green), Hb (red), Kr (yellow), Eve (blue), and CF (black) of stau mutants (left) and the WT (right). The top two figures are living images of Bcd-GFP at 16 min into nc 14, and the next three rows of figures are the immunofluorescence images of Hb, Kr, and Eve at around 35 min into nc 14. The last row is the bright field image of CF at around 56 min into nc 14. The scale bars represent 40 μm. The first scale bar is for the top two images and the second one for the rest. The second scale bar is slightly longer due to shrinkage after heat fixation.
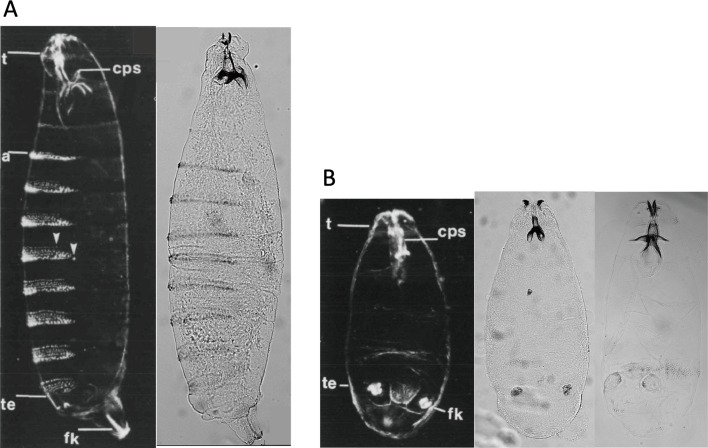
Figure 4—figure supplement 3. Cuticle patterns of stau mutants.

Figure 4—figure supplement 3.

Cuticle patterns of the stau mutants prepared with CRISPR are consistent with the published record (Lehmann and Nüsslein-Volhard, 1991). (A) Comparison of the dark field image of the cuticle pattern of the WT in Lehmann and Nüsslein-Volhard, 1991 and the bright field image of the WT in our experiment. (B) Comparison of the dark field image of the cuticle pattern of stau mutants in Lehmann and Nüsslein-Volhard, 1991 and the bright field images of stauD3 and stauHL54 prepared with CRISPR technique.