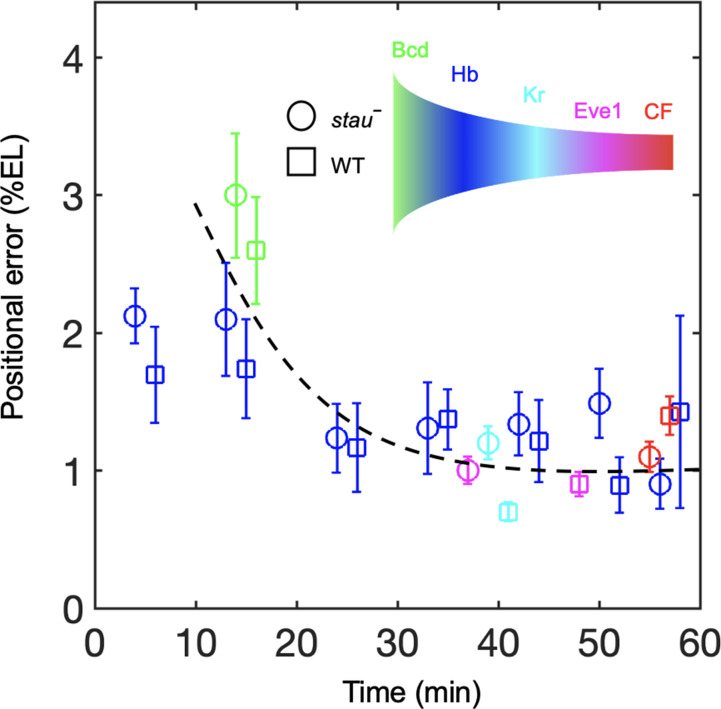
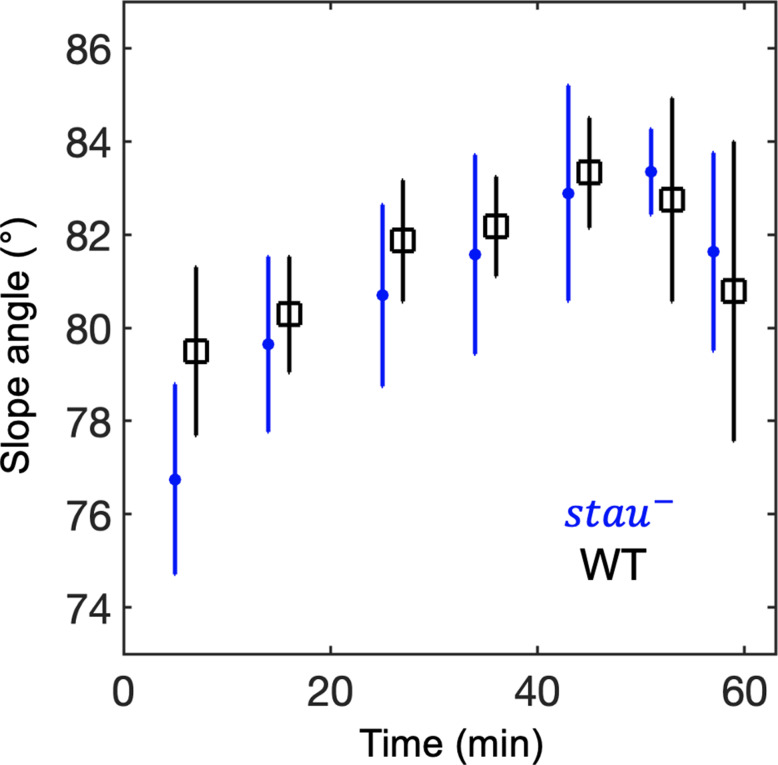
Figure 5. Positional noise is filtered from Bcd to CF.
Positional errors in Bcd (green), Hb (blue), Kr (cyan), Eve (magenta) and CF (red) of stau– mutants (circle) and the WT (square) as a function of developmental time in nc14. Positional errors are calculated from the Bcd gradients (Figure 2A) after subtracting the imaging noise and image mask noise from the gradient noise (Figure 2B). The standard deviation of the average positional noise is calculated on the basis of bootstrapping. For presentation purposes, data for Bcd, Kr and CF measured at the same time point are shown with 1 min offset on the x axis. The black line connects the data points to guide the eye.


