. 2020 Jun 8;9:e54276. doi: 10.7554/eLife.54276

Figure 6. Origin of the large shift in xHb in stau mutants.

(A–C) Schematic of maternal gradients and Hb dynamic expression in the WT (A), stau mutants (B), and Bcd1.0 (C). In stau mutants, the Bcd gradient (yellow) decreases in amplitude and increases in length constant. The depletion of the Nos gradient (purple) flattens the maternal Hb gradient (orange). In Bcd1.0, the Bcd gradient decreases in amplitude by half. xHb moves posteriorly from early, to middle and late nc14. It mainly moves in the first 30 mins in nc14 in stau mutants and the shift amount is much greater than in the WT. By contrast, xHb mainly moves in the later 30 mins of nc14 in Bcd1.0. (D) The mathematical model fitting (lines) agrees well with the measured shift of xHb in the WT (black circles) and stau mutants (blue circles), but not Bcd1.0 (red circles). The simulation result without the distortion effect on the Nos gradient in stau mutants (blue dashed line) fails to replicate the measured results. Error bars represent the standard deviation of xHb in each time window.

Figure 6—source data 1. Model parameters.
Figure 6—source data 2. Source data for Figure 6 and Figure 6—figure supplement 1.

Figure 6.

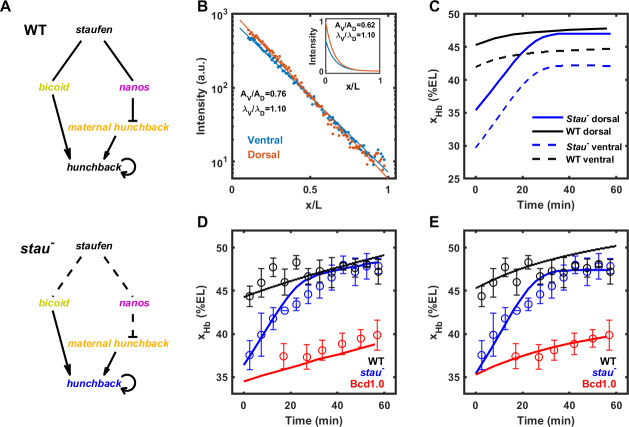
Figure 6—figure supplement 1. Mathematical modeling of the shift of xHb.

Figure 6—figure supplement 1.

(A) The regulation network of maternal genes and Hb in the WT (top) and in stau mutants (below). The arrow (→) and the T-bar (—|) symbols represent activation and repression, respectively. The dashed line represents the missing regulatory interactions. (B) Comparison of the measured average Bcd gradient (n = 11) on the ventral side (blue dots) and the dorsal (red dots) side. The fitting results (lines) show that the amplitude decreases from 1078 on the dorsal side by 24% to 814 on the ventral side, whereas the length constant increases from 19.0% EL on the dorsal side by 10% to 21.0% EL on the ventral side. Inset: the dorsal and ventral Bcd gradients in the simulation with the best-fitting result. (C) The simulated xHb on the ventral side (dashed line) posteriorly moves 6% EL and 3% EL compared with the dorsal side (solid line) in stau mutants (blue) and the WT (black). (D, E) After removing the time-varying effect of Bcd gradients, the mathematical model fitting (lines) of xHb does not stabilize in the late nc14 in the WT (black circles) or in stau mutants (blue circles) as shown in the experiment whether using the updated (D) or same (E) optimized parameters. Error bars represent the standard deviation of xHb in each time window.