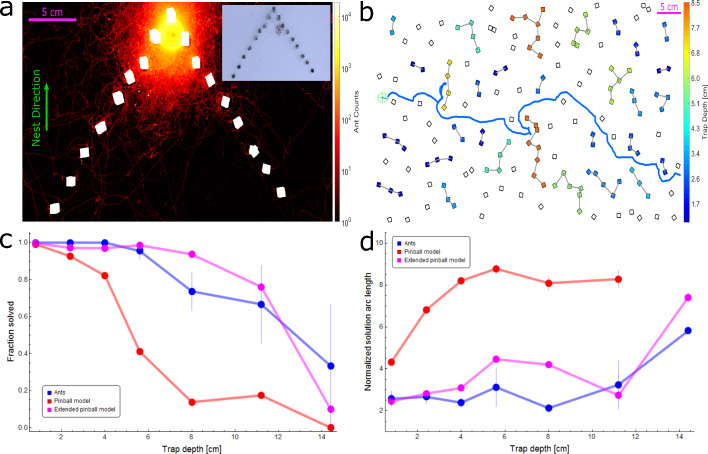
Figure 3. Simulation and ant performance near traps.
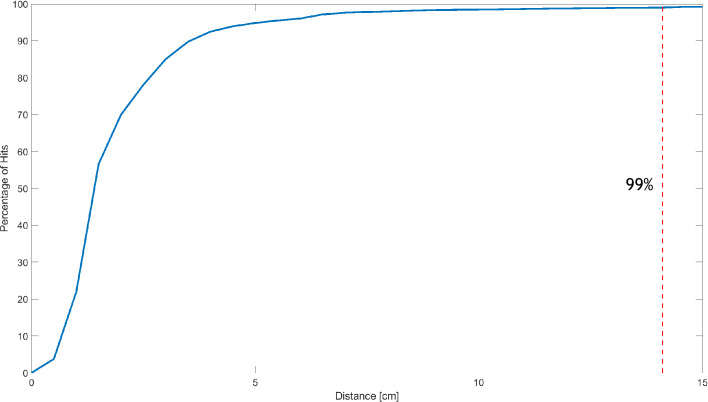
(a) Logarithmic heat map showing the spread of ants while the load is located near the deepest point of a triangular trap (extracted from 23 min of footage). The nest direction is towards the top. Color intensity represents the total number of ant counts within each 2D bin over the aforementioned experimental duration. A radius area centered on the load contains ∼99% of ant traffic in the vicinity of the load (see Figure 3—figure supplement 1). Inset shows an example image from the video footage of the experiment. (b) Illustration of traps on a sample maze. Each group of cubes comprising a trap are connected by gray lines and colored according to the trap depth in cm (as defined in Appendix 1.5) corresponding to the color bar. The empirical ant trajectory for this particular realization is plotted in blue (initial location marked using a pale green cogwheel). Nest direction is to the right. (C) Probability of trap solution as a function of trap depth for ants (blue), pinball model (red), and extended pinball model (magenta). Sample sizes (from shallow trap to deep): Ants - 73,70,35,22,19,6,3, Pinball Model - 2645,2886,1646,1289,982,343,105, Extended Pinball Model - 8979,8203,4637,3395,2042,815,403. (d) Average normalized arc length of the trajectory taken to solve a trap as a function of trap depth for ants and simulations (color scheme as in (c)). Trajectory lengths are normalized by trap depth (see Appendix 1.5, Materials and methods). Ant performance is approximately constant up to cm which is on the scale of (see panel (a)). Sample sizes: Ants - 73,70,35,21,14,4,1, Pinball Model - 2620,2675,1352,530,136,60,0, Extended Pinball Model - 8952,7969,4497,3347,1913,620,302. Error margins in (c,d) are standard errors of the mean. Wherever no error is visible, the error is small enough to fit within the filled circle marker.


