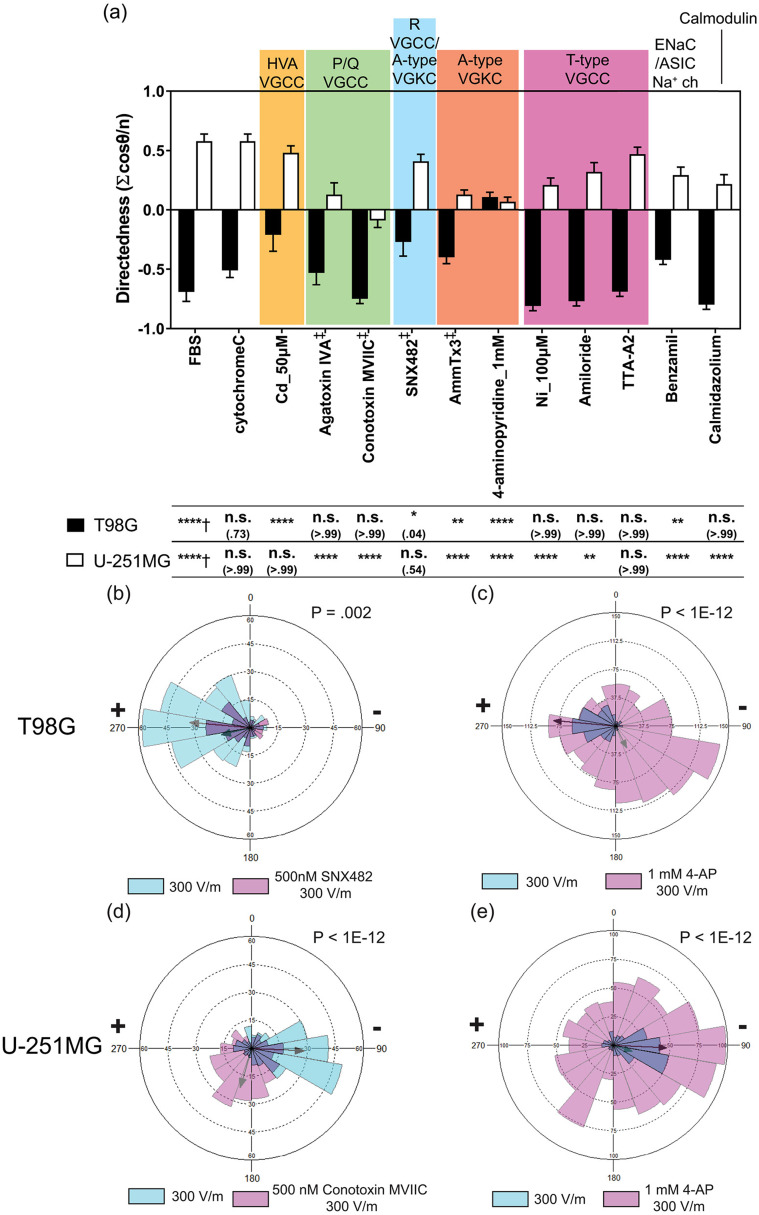
FIG. 4.
Inhibitory effects of selected ion channels on glioblastoma cell electrotaxis. (a) The electrotactic directedness of T98G and U-251MG glioblastoma cells under 300 V m−1 dcEF after 6 h with pharmacological inhibition on various ion channels. indicates the electrotaxis tested against those without EF stimulation; indicates the electrotaxis group tested against those with cytochrome C which prevents adsorption of short peptides to experimental apparatus; All other groups are statistically compared to their respective controls in cell culture media with 10% FBS; n.s. indicates not significant; * indicates P < 0.05; ** indicates P < 0.01; *** indicates P < 0.001; **** indicates P < 0.0001; the numbers in parentheses indicate actual P-values; [(b) and (c)] Rose plots showing the frequency of T98G electrotaxis with and without the presence of SNX482 (R-type VGCC inhibitor) and 4-AP (A-type VGKC inhibitor); the r-vectors displaying the direction tendencies of each group are indicated by the arrows; P values in Mardia–Watson–Wheeler tests are shown; (d) and (e) rose plots showing the frequency of U-251MG electrotaxis with and without the presence of ω-conotoxin-MVIIC (P/Q-type VGCC inhibitor) and 4-AP; The r-vectors displaying the direction tendencies of each group are indicated by the arrows; P values in Mardia–Watson–Wheeler tests are indicated. Note that the scale in [(b) and (d)] is different from that in [(c) and (e)] due to different numbers of cells analyzed. The histograms represent the frequencies of cells moved in each direction.

