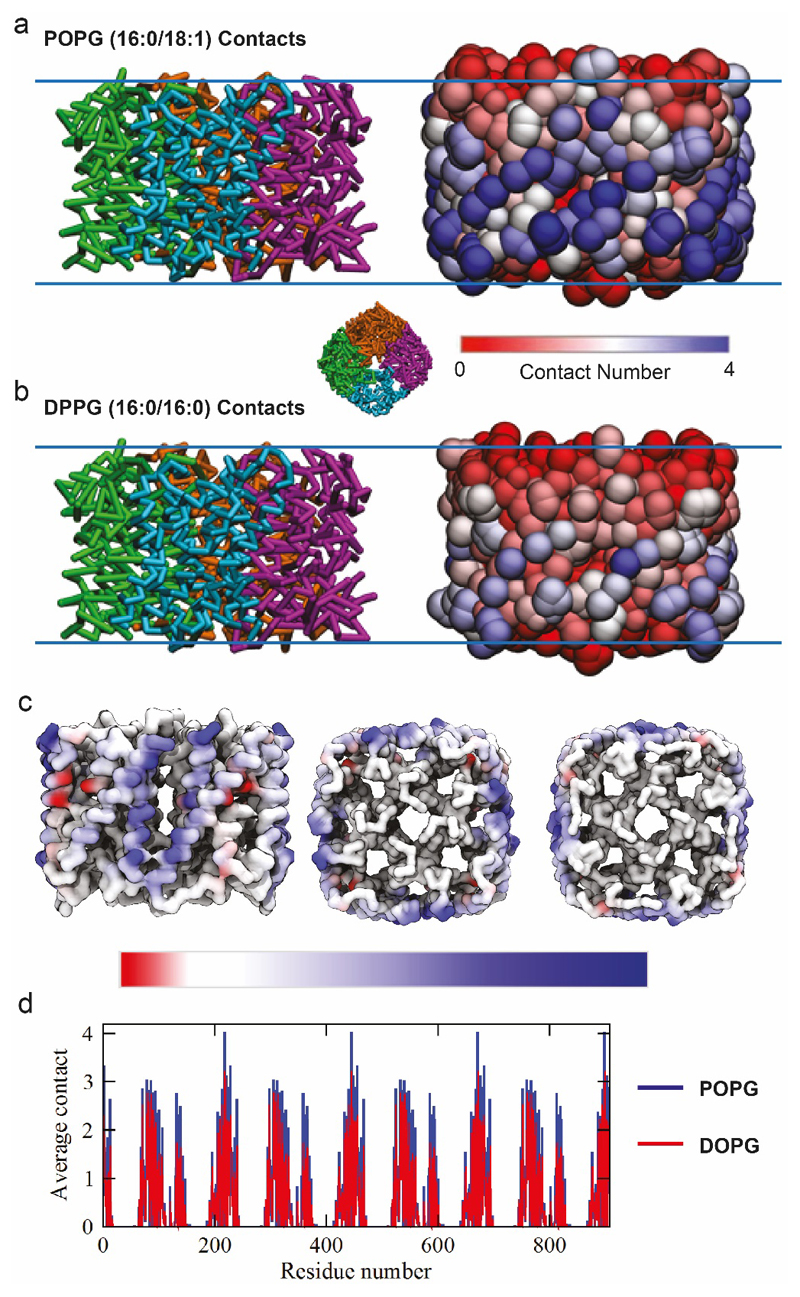
Extended Data Figure 6. MD simulations of AqpZ in mixed lipid bilayers.
(a) Side view snapshots of aquaporin in the POPE-POPG bilayer after 3780 ns of simulation time. Snapshots show the protein backbone-bonding scheme (left) and using a RWB colour bar, protein residues are coloured according to the number of times they come into contact with POPG lipids (based on a 0.6 nm cutoff), during the last 1000 ns of simulation time (right). The inset figure shows a representative top view snapshot of aquaporin. (b) Side view snapshots of aquaporin in the POPE-DPPG bilayer after 3780 ns of simulation time. Snapshots show the protein backbone-bonding scheme (left) and using a RWB colour bar, protein residues are coloured according to the number of times they come into contact with DOPG lipids, during the last 1000 ns of simulation time (right). (c) The number of aquaporin-DOPG contacts is subtracted from the number of aquaporin-POPG contacts (during the last 1000 ns of simulation time) and the resulting quantities (per residue) are assigned a colour based on the asymmetric RWB colour bar provided. In other words, the differences in lipid binding per residue (based on a 0.6 nm cut-off) are depicted using a RWB colour scale for clarity. (d) The average number of contacts for each residue of aquaporin (based on a 0.6 nm cut-off) during the last 1000 ns of simulation time. Data are shown for the simulations with POPG (blue) and DOPG (red) lipids.

