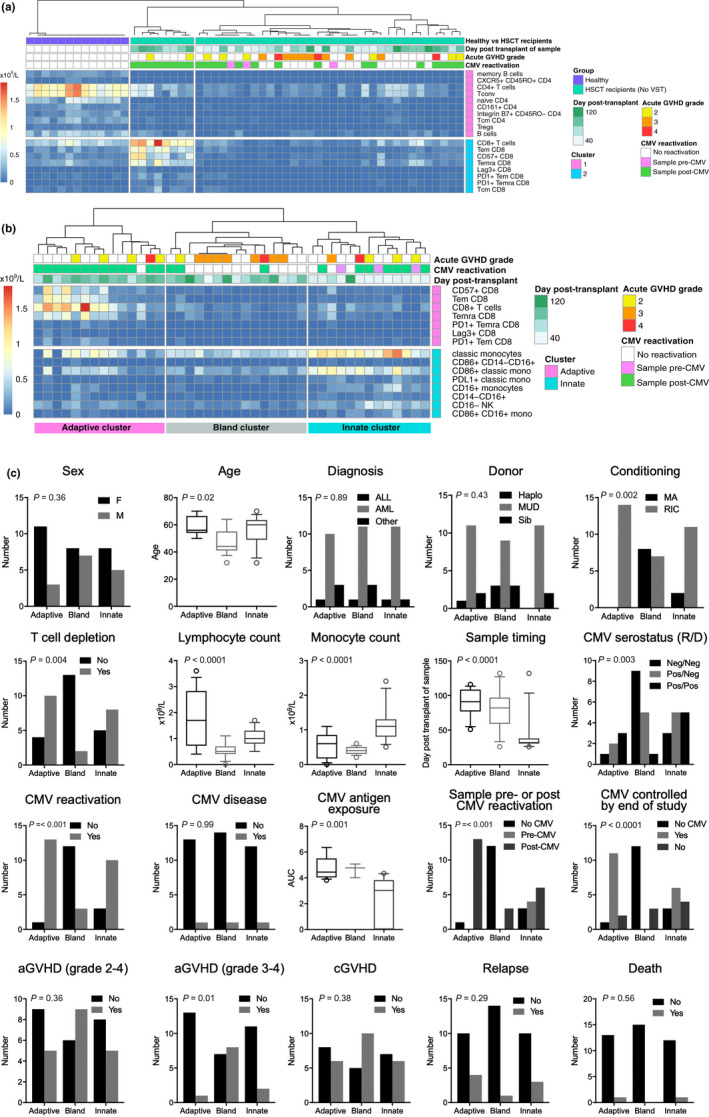
Figure 2.

Immune profiles by unsupervised biaxial consensus clustering. (a) In healthy individuals (n = 13; samples collected at steady state) and patients undergoing HSCT without VST (n = 13; up to four timepoints from each patient, day 26 to 132 post‐HSCT). (b) In samples from the patients undergoing HSCT alone (without VST recipients; same samples as in a). Clusters from left to right are designated adaptive, bland and innate, respectively. In the heatmaps in a and b, columns represent samples, and rows represent the cell subsets. All cell subsets from all samples were included in the unsupervised analysis but only subsets contributing significantly to the clustering are visualised in the output. All timepoints were included to allow changes over time to be considered as a variable in subsequent analysis. Clinical annotation in the boxes above the heatmap is shown for reference but was not included in the SC3 analysis. The heatmap colour scale = 0 to > 2 × 10⁹ cells/L. (c) Influence of clinical factors on immune profiles. To assess the impact of patient and transplant characteristics on the immune profile of a sample, univariate analysis was performed. P‐values are based on univariate analysis with Bonferroni correction for multiple tests (α/18). On the x‐axis, the three clusters identified in b are shown. Log10AUC = logarithm of the area under the curve of viral copy number, as a measure of CMV antigen exposure.
