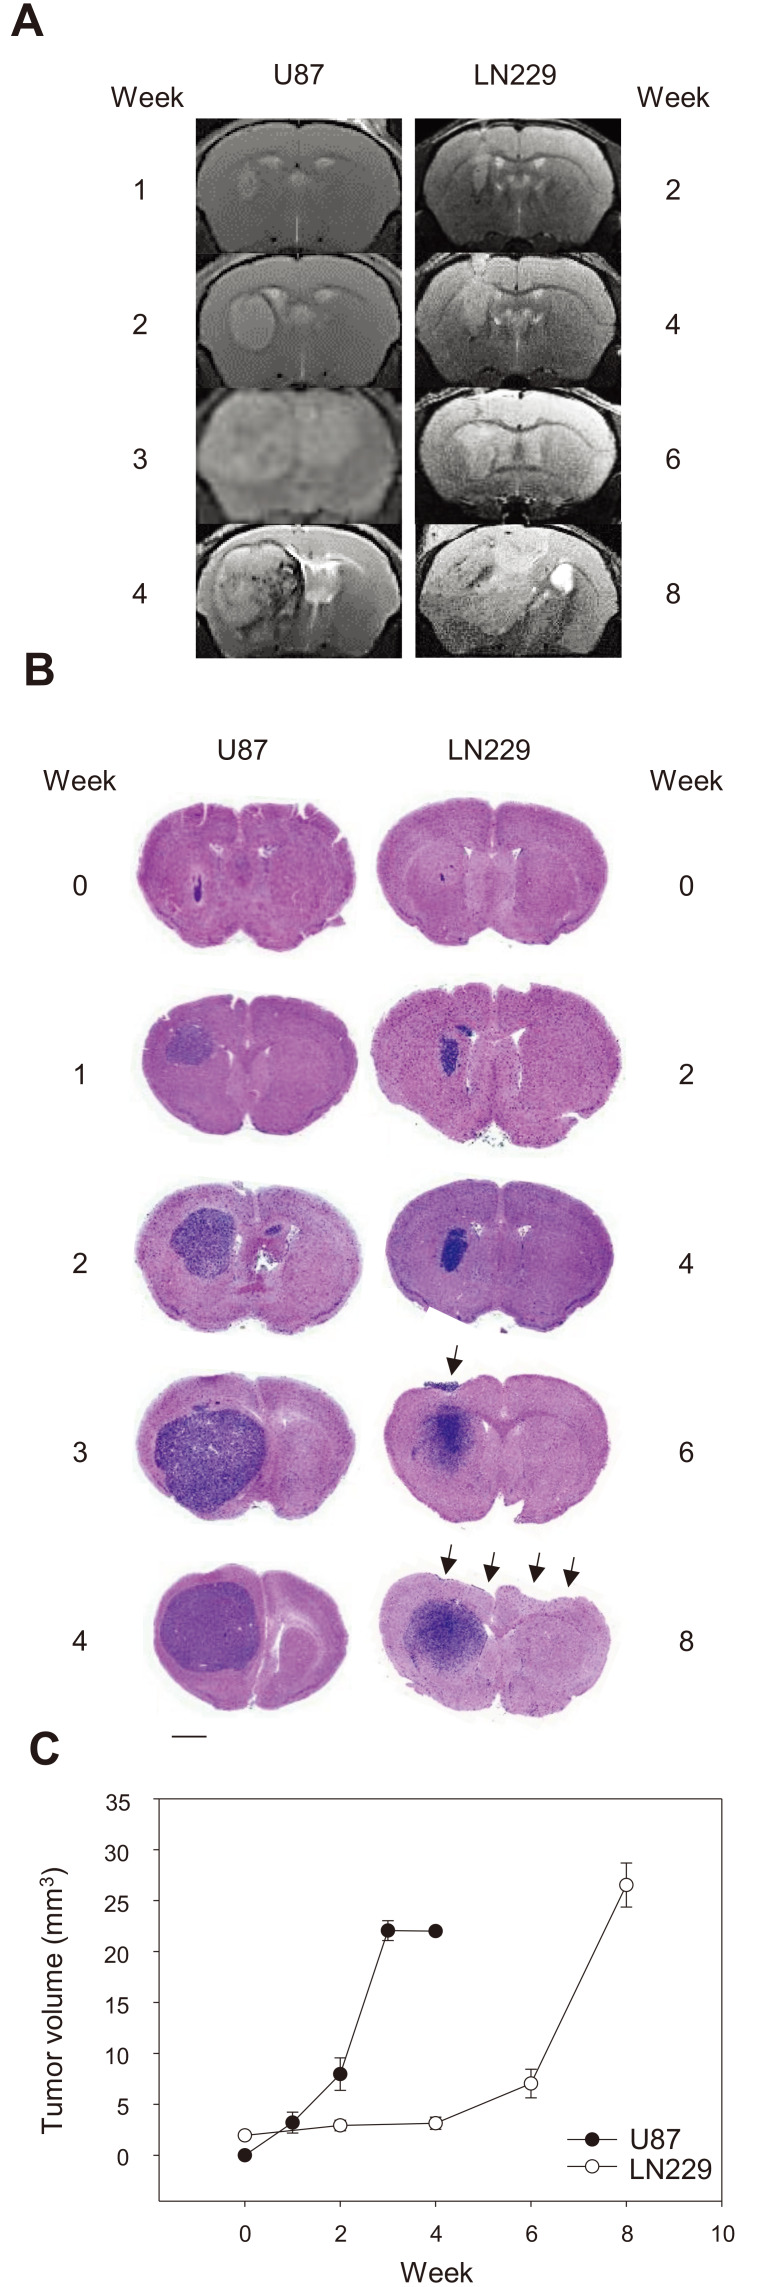
Fig. 2. Tumor growth in two GBM cell lines in orthotopic xenograft mouse models.
(A) T2-weighted MRI scans of mouse brains at the indicated time points after tumor transplantation. (B) H&E staining of brain sections showing the tumor xenografts of U87/GFP and LN229/GFP cells. Note the ectopic location of LN229/GFP cells (arrows). Scale bar = 1 mm. (C) Quantification of histological images at the indicated time showing the tumor volume as mean ± SE (3 representative sections per animal and 3 animals per group).

