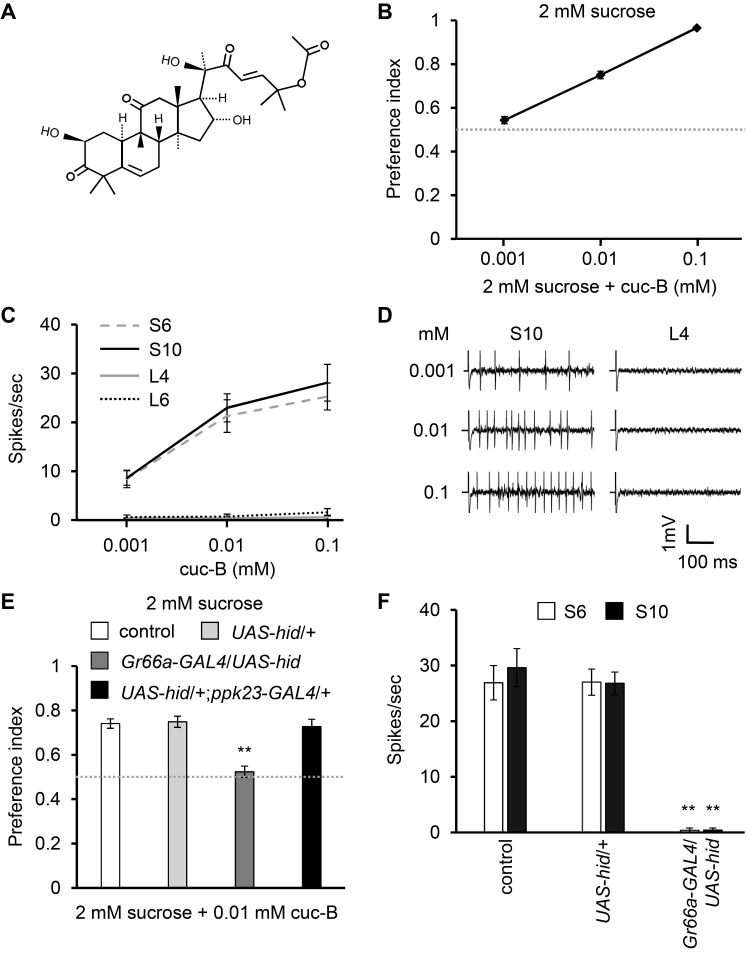
Fig. 1. cuc-B structure, responses to cuc-B in wild-type control and ablated flies.
(A) Structure of cuc-B. (B) Binary food choice assay showing preferences of flies to 2 mM sucrose vs 2 mM sucrose plus the indicated concentrations of cuc-B (n = 4-6). (C) Average frequencies of action potentials elicited from S6, S10, L4, and L6 sensilla with the indicated concentrations of cucurbitacin (n = 15-18). (D) Representative sample traces obtained from S10 and L4 sensilla. (E) Binary food choice assays with control, parent strain (UAS-hid/+), each bitter-sensing GRNs- or calcium-sensing GRNs-ablated flies (n = 4-6). (F) Average frequencies of action potentials elicited from S6 and S10 sensilla with 0.1 mM cuc-B (n = 10-14). All error bars represent SEM. Single factor ANOVA with Scheffe’s analysis was used as a post hoc test to compare multiple sets of data. Asterisks indicate statistical significance (**P < 0.01).

