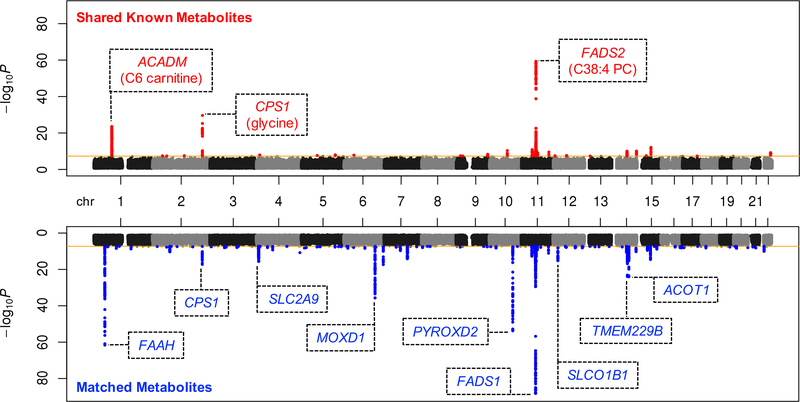
Figure 2. Joint Manhattan plots summarizing GWAS of BMI-associated metabolites in OE and MCDS.
Genetic associations for 100 shared known (top) or 477 matched (bottom) BMI-associated metabolites were consolidated to plot the best p-value for each SNP (i.e. only the p-value for the best associated metabolite was plotted for each SNP). Genome-wide significance threshold (p < 5 × 10⁻⁸) is marked by the orange lines. Genome-wide significant SNPs are plotted in red or blue, for shared known or matched metabolites, respectively. Lead SNPs of the most significant loci (p < 1 × 10⁻¹⁵) are annotated with nearest genes (within 5kb), along with the best associated known metabolites if applicable.

