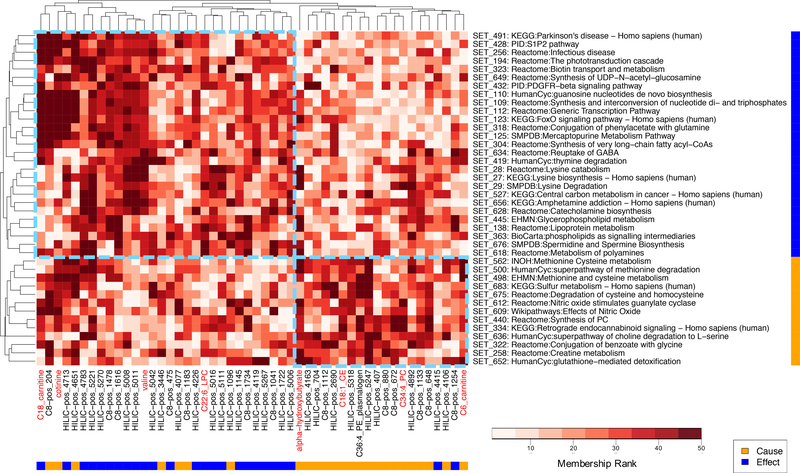
Figure 4. Clustered heat map of cause and effect metabolites’ memberships in metabolite sets prioritized by pathway analysis.
Euclidean distance-based hierarchical clustering was performed using metabolite membership ranks in the BioAge-based metabolite set annotations. Each column is a shared known (red label) or matched (black label) metabolite from the cause (yellow bar) or effect (blue bar) metabolite group. Each row is an enriched (p < 0.05) metabolite set in pathway analysis in either the cause (yellow bar) or effect (blue bar) direction (with representative pathway name shown in label; see Supplementary Table 7 for full pathway list). Larger number in membership rank (darker red) indicates higher membership score. Dashed light blue boxes highlight the two major cause and effect clusters according to the clustering dendrograms.

